

Observability
Observability is key for debugging workflows. Beyond just adding print() statements, workflows ship with an extensive instrumentation system that tracks the input and output of every workflow step.
Furthermore, you can leverage this instrumentation system to add observability to any function outside of workflow steps! More in-depth examples for all of this information can be found in the examples folder for observability.
OpenTelemetry Integration
Section titled “OpenTelemetry Integration”Workflows integrate with OpenTelemetry for exporting traces. You can use the llama-index-observability-otel package:
from llama_index.observability.otel import LlamaIndexOpenTelemetry
# Initialize with your span exporterinstrumentor = LlamaIndexOpenTelemetry(    span_exporter=your_span_exporter,    service_name_or_resource="your_service_name",)
# Start registering tracesinstrumentor.start_registering()
All workflow steps, LLM calls, and custom events are automatically captured and exported as OpenTelemetry spans with detailed attributes including:
- Span names for each workflow step
- Start and end times
- Event attributes (input data, output data, etc.)
- Nested span relationships showing execution flow
Third-Party Observability Tools
Section titled “Third-Party Observability Tools”Workflows integrate seamlessly with popular observability platforms:
Arize Phoenix
Section titled “Arize Phoenix”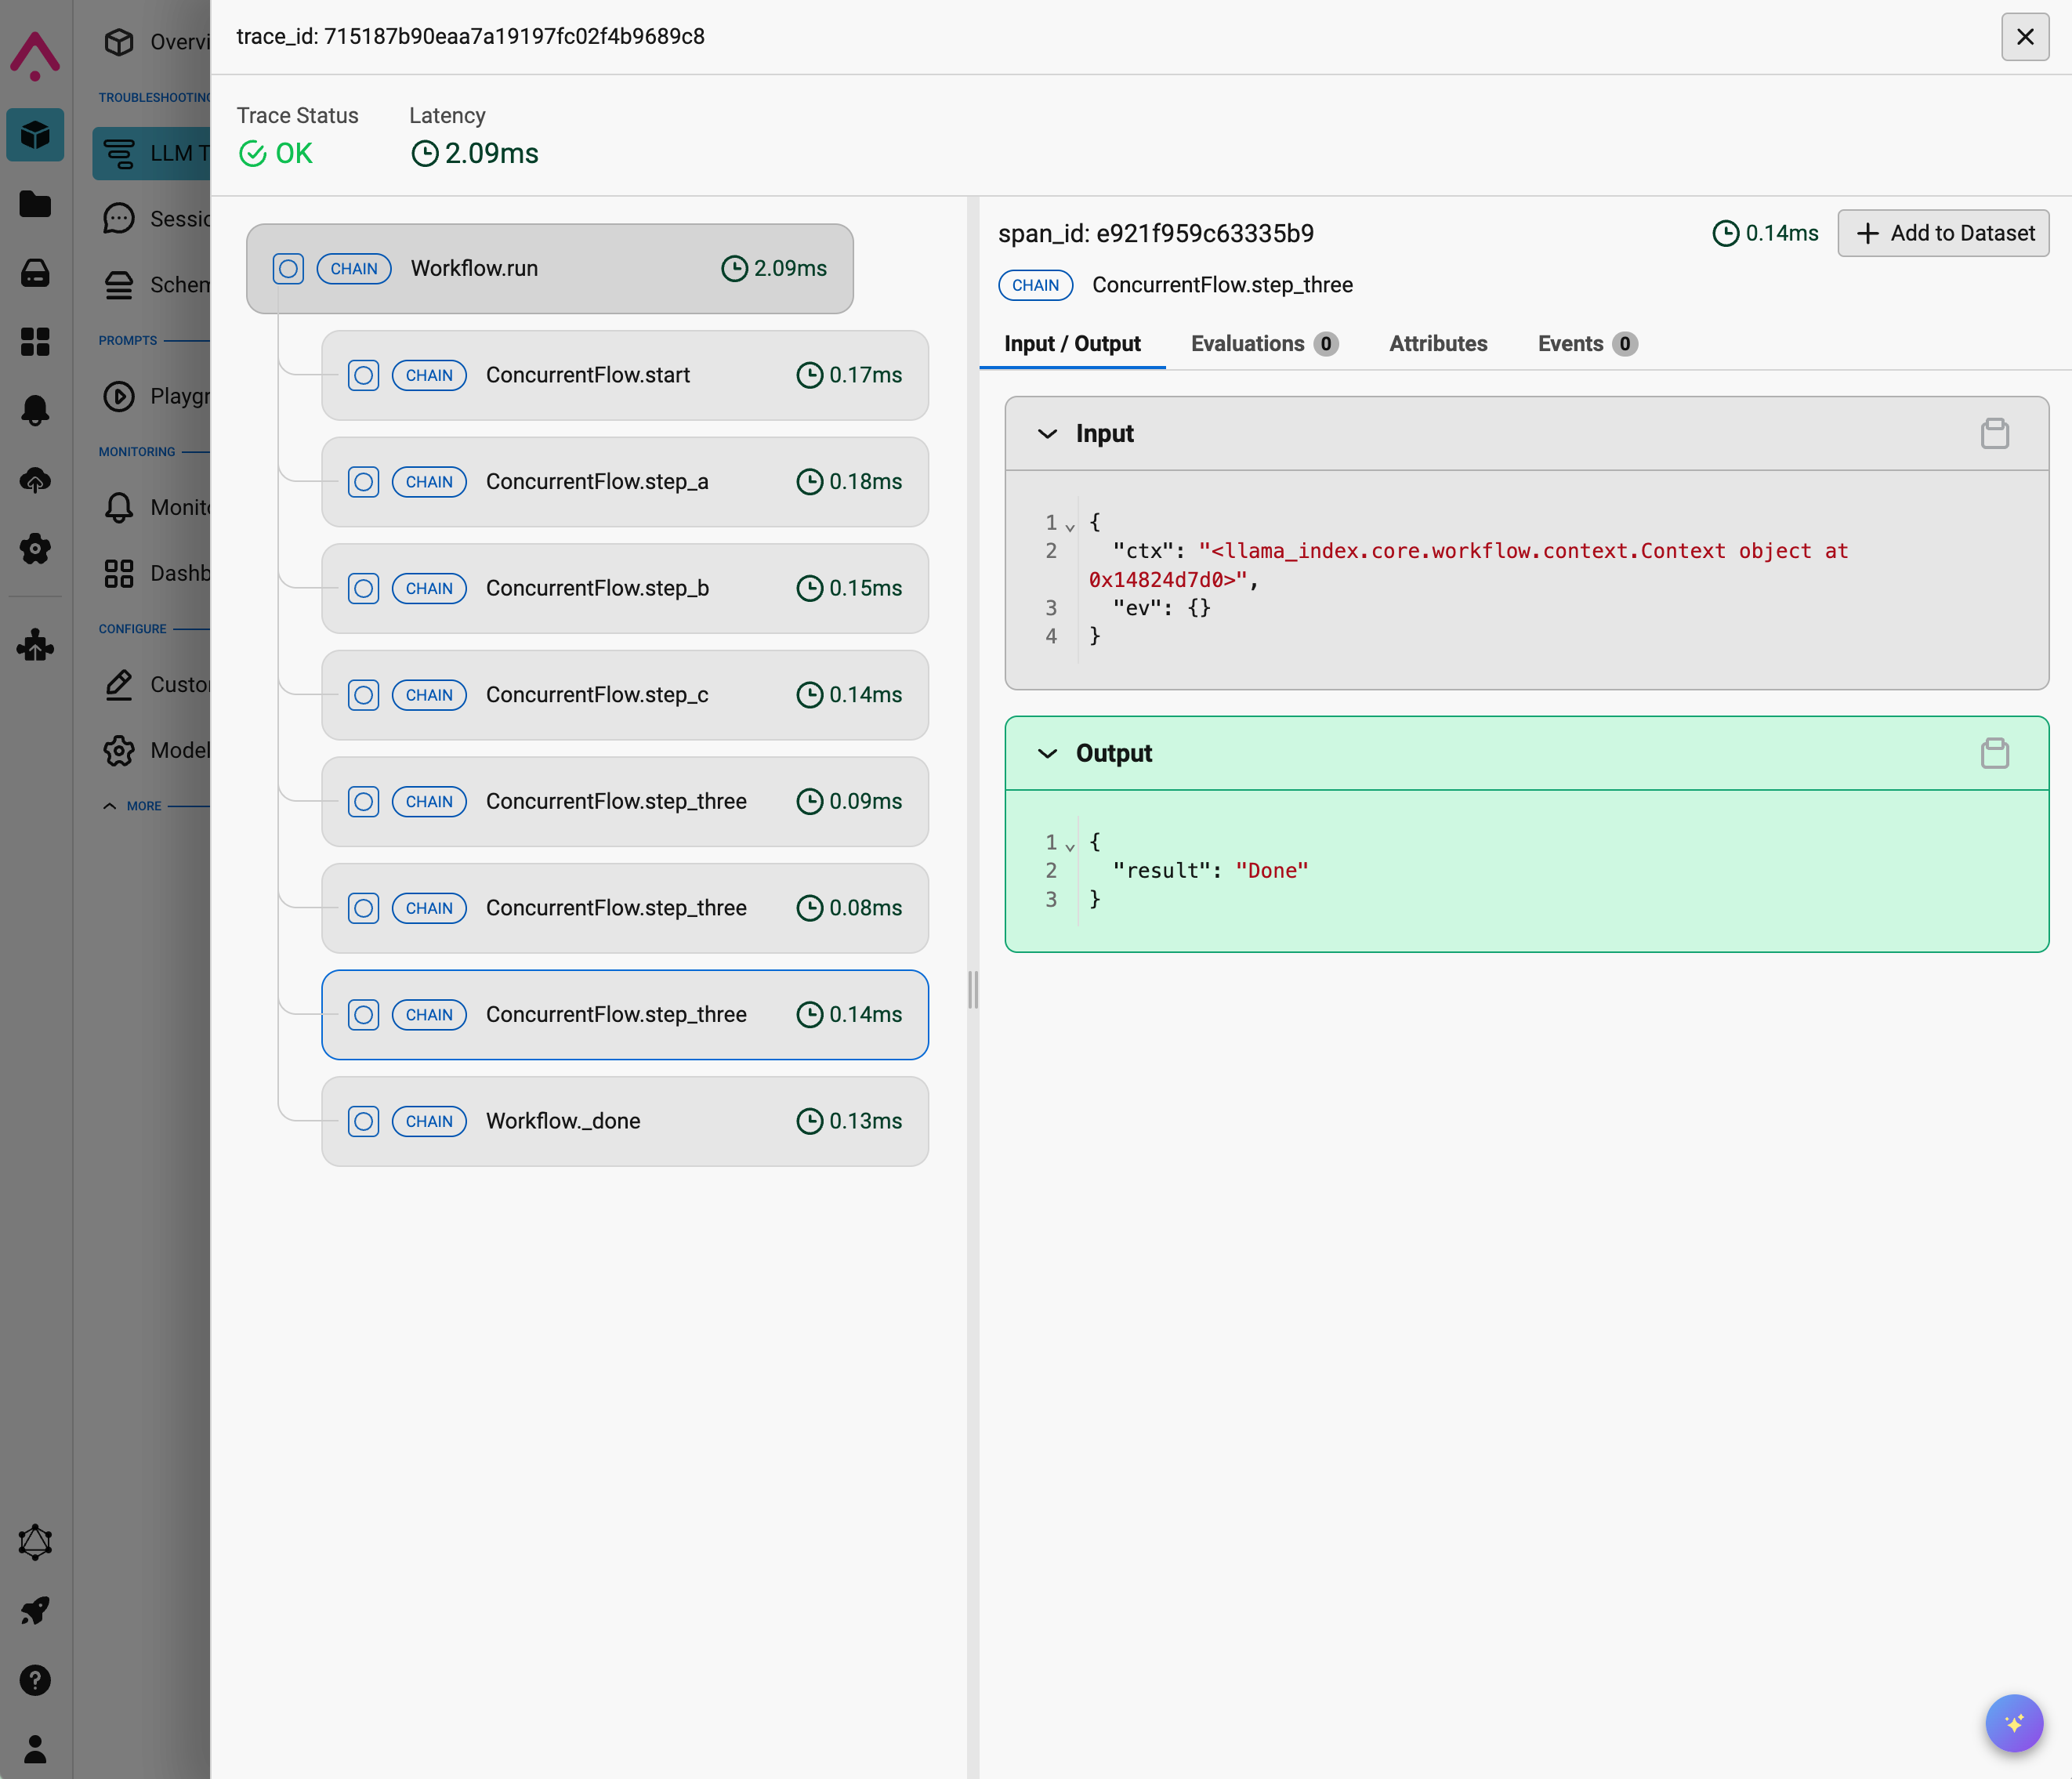
Arize Phoenix provides real-time tracing and visualization for your workflows.
You can read more in the example notebook.
Langfuse
Section titled “Langfuse”Langfuse directly integrates with the instrumentation system that ships with workflows.
You can read more in the example notebook.
Opik can receive workflow traces through the same OpenTelemetry pipeline used by workflows.
To configure export to Opik, use the OpenTelemetry setup above and point your exporter to Opik’s OTLP endpoint. See the Opik OpenTelemetry Python SDK guide.
Custom Spans and Events
Section titled “Custom Spans and Events”You can define custom spans and events using the LlamaIndex dispatcher to add fine-grained tracing to your code:
from llama_index_instrumentation import get_dispatcherfrom llama_index_instrumentation.base import BaseEvent
dispatcher = get_dispatcher()
# Define custom eventsclass ExampleEvent(BaseEvent):    data: str
class AnotherExampleEvent(BaseEvent):    print_statement: str
# Use the @dispatcher.span decorator@dispatcher.spandef example_fn(data: str) -> None:    dispatcher.event(ExampleEvent(data=data))    s = "This are example string data: " + data    dispatcher.event(AnotherExampleEvent(print_statement=s))    print(s)
When you call instrumented functions, all spans and events are automatically captured by any configured tracing backend.
See complete examples in the examples/observability directory.