

Observability
LlamaIndex provides one-click observability 🔭 to allow you to build principled LLM applications in a production setting.
A key requirement for principled development of LLM applications over your data (RAG systems, agents) is being able to observe, debug, and evaluate your system - both as a whole and for each component.
This feature allows you to seamlessly integrate the LlamaIndex library with powerful observability/evaluation tools offered by our partners. Configure a variable once, and you’ll be able to do things like the following:
- View LLM/prompt inputs/outputs
- Ensure that the outputs of any component (LLMs, embeddings) are performing as expected
- View call traces for both indexing and querying
Each provider has similarities and differences. Take a look below for the full set of guides for each one!
NOTE:
Observability is now being handled via the instrumentation module (available in v0.10.20 and later.)
A lot of the tooling and integrations mentioned in this page use our legacy CallbackManager or don’t use set_global_handler. We’ve marked these integrations as such!
Usage Pattern
Section titled “Usage Pattern”To toggle, you will generally just need to do the following:
from llama_index.core import set_global_handler
# general usageset_global_handler("<handler_name>", **kwargs)
Note that all kwargs to set_global_handler are passed to the underlying callback handler.
And that’s it! Executions will get seamlessly piped to downstream service and you’ll be able to access features such as viewing execution traces of your application.
Integrations
Section titled “Integrations”OpenTelemetry
Section titled “OpenTelemetry”OpenTelemetry is a widely used open-source service for tracing and observability, with numerous backend integrations (such as Jaeger, Zipkin or Prometheus).
Our OpenTelemetry integration traces all the events produced by pieces of LlamaIndex code, including LLMs, Agents, RAG pipeline components and many more: everything you would get out with LlamaIndex native instrumentation you can export in OpenTelemetry format!
You can install the library with:
pip install llama-index-observability-otelAnd can use it in your code with the default settings, as in this example with a RAG pipeline:
from llama_index.observability.otel import LlamaIndexOpenTelemetryfrom llama_index.core import SimpleDirectoryReader, VectorStoreIndexfrom llama_index.llms.openai import OpenAIfrom llama_index.embeddings.openai import OpenAIEmbeddingfrom llama_index.core import Settings
# initialize the instrumentation objectinstrumentor = LlamaIndexOpenTelemetry()
if __name__ == "__main__":    embed_model = OpenAIEmbedding(model_name="text-embedding-3-small")    llm = OpenAI(model="gpt-4.1-mini")
    # start listening!    instrumentor.start_registering()
    # register events    documents = SimpleDirectoryReader(        input_dir="./data/paul_graham/"    ).load_data()
    index = VectorStoreIndex.from_documents(documents, embed_model=embed_model)    query_engine = index.as_query_engine(llm=llm)
    query_result_one = query_engine.query("Who is Paul?")    query_result_two = query_engine.query("What did Paul do?")
Or you can use a more complex and customized set-up, such as in the following example:
import jsonfrom pydantic import BaseModel, Fieldfrom typing import List
from llama_index.observability.otel import LlamaIndexOpenTelemetryfrom opentelemetry.exporter.otlp.proto.http.trace_exporter import (    OTLPSpanExporter,)
# define a custom span exporterspan_exporter = OTLPSpanExporter("http://0.0.0.0:4318/v1/traces")
# initialize the instrumentation objectinstrumentor = LlamaIndexOpenTelemetry(    service_name_or_resource="my.test.service.1",    span_exporter=span_exporter,    debug=True,)

if __name__ == "__main__":    instrumentor.start_registering()    # ... your code here
We also have a demo repository where we show how to trace agentic workflows and pipe the registered traces into a Postgres database.
LlamaTrace (Hosted Arize Phoenix)
Section titled “LlamaTrace (Hosted Arize Phoenix)”We’ve partnered with Arize on LlamaTrace, a hosted tracing, observability, and evaluation platform that works natively with LlamaIndex open-source users and has integrations with LlamaCloud.
This is built upon the open-source Arize Phoenix project. Phoenix provides a notebook-first experience for monitoring your models and LLM Applications by providing:
- LLM Traces - Trace through the execution of your LLM Application to understand the internals of your LLM Application and to troubleshoot problems related to things like retrieval and tool execution.
- LLM Evals - Leverage the power of large language models to evaluate your generative model or application’s relevance, toxicity, and more.
Usage Pattern
Section titled “Usage Pattern”To install the integration package, do pip install -U llama-index-callbacks-arize-phoenix.
Then create an account on LlamaTrace: https://llamatrace.com/login. Create an API key and put it in the PHOENIX_API_KEY variable below.
Then run the following code:
# Phoenix can display in real time the traces automatically# collected from your LlamaIndex application.# Run all of your LlamaIndex applications as usual and traces# will be collected and displayed in Phoenix.
# setup Arize Phoenix for logging/observabilityimport llama_index.coreimport os
PHOENIX_API_KEY = "<PHOENIX_API_KEY>"os.environ["OTEL_EXPORTER_OTLP_HEADERS"] = f"api_key={PHOENIX_API_KEY}"llama_index.core.set_global_handler(    "arize_phoenix", endpoint="https://llamatrace.com/v1/traces")
...
Guides
Section titled “Guides”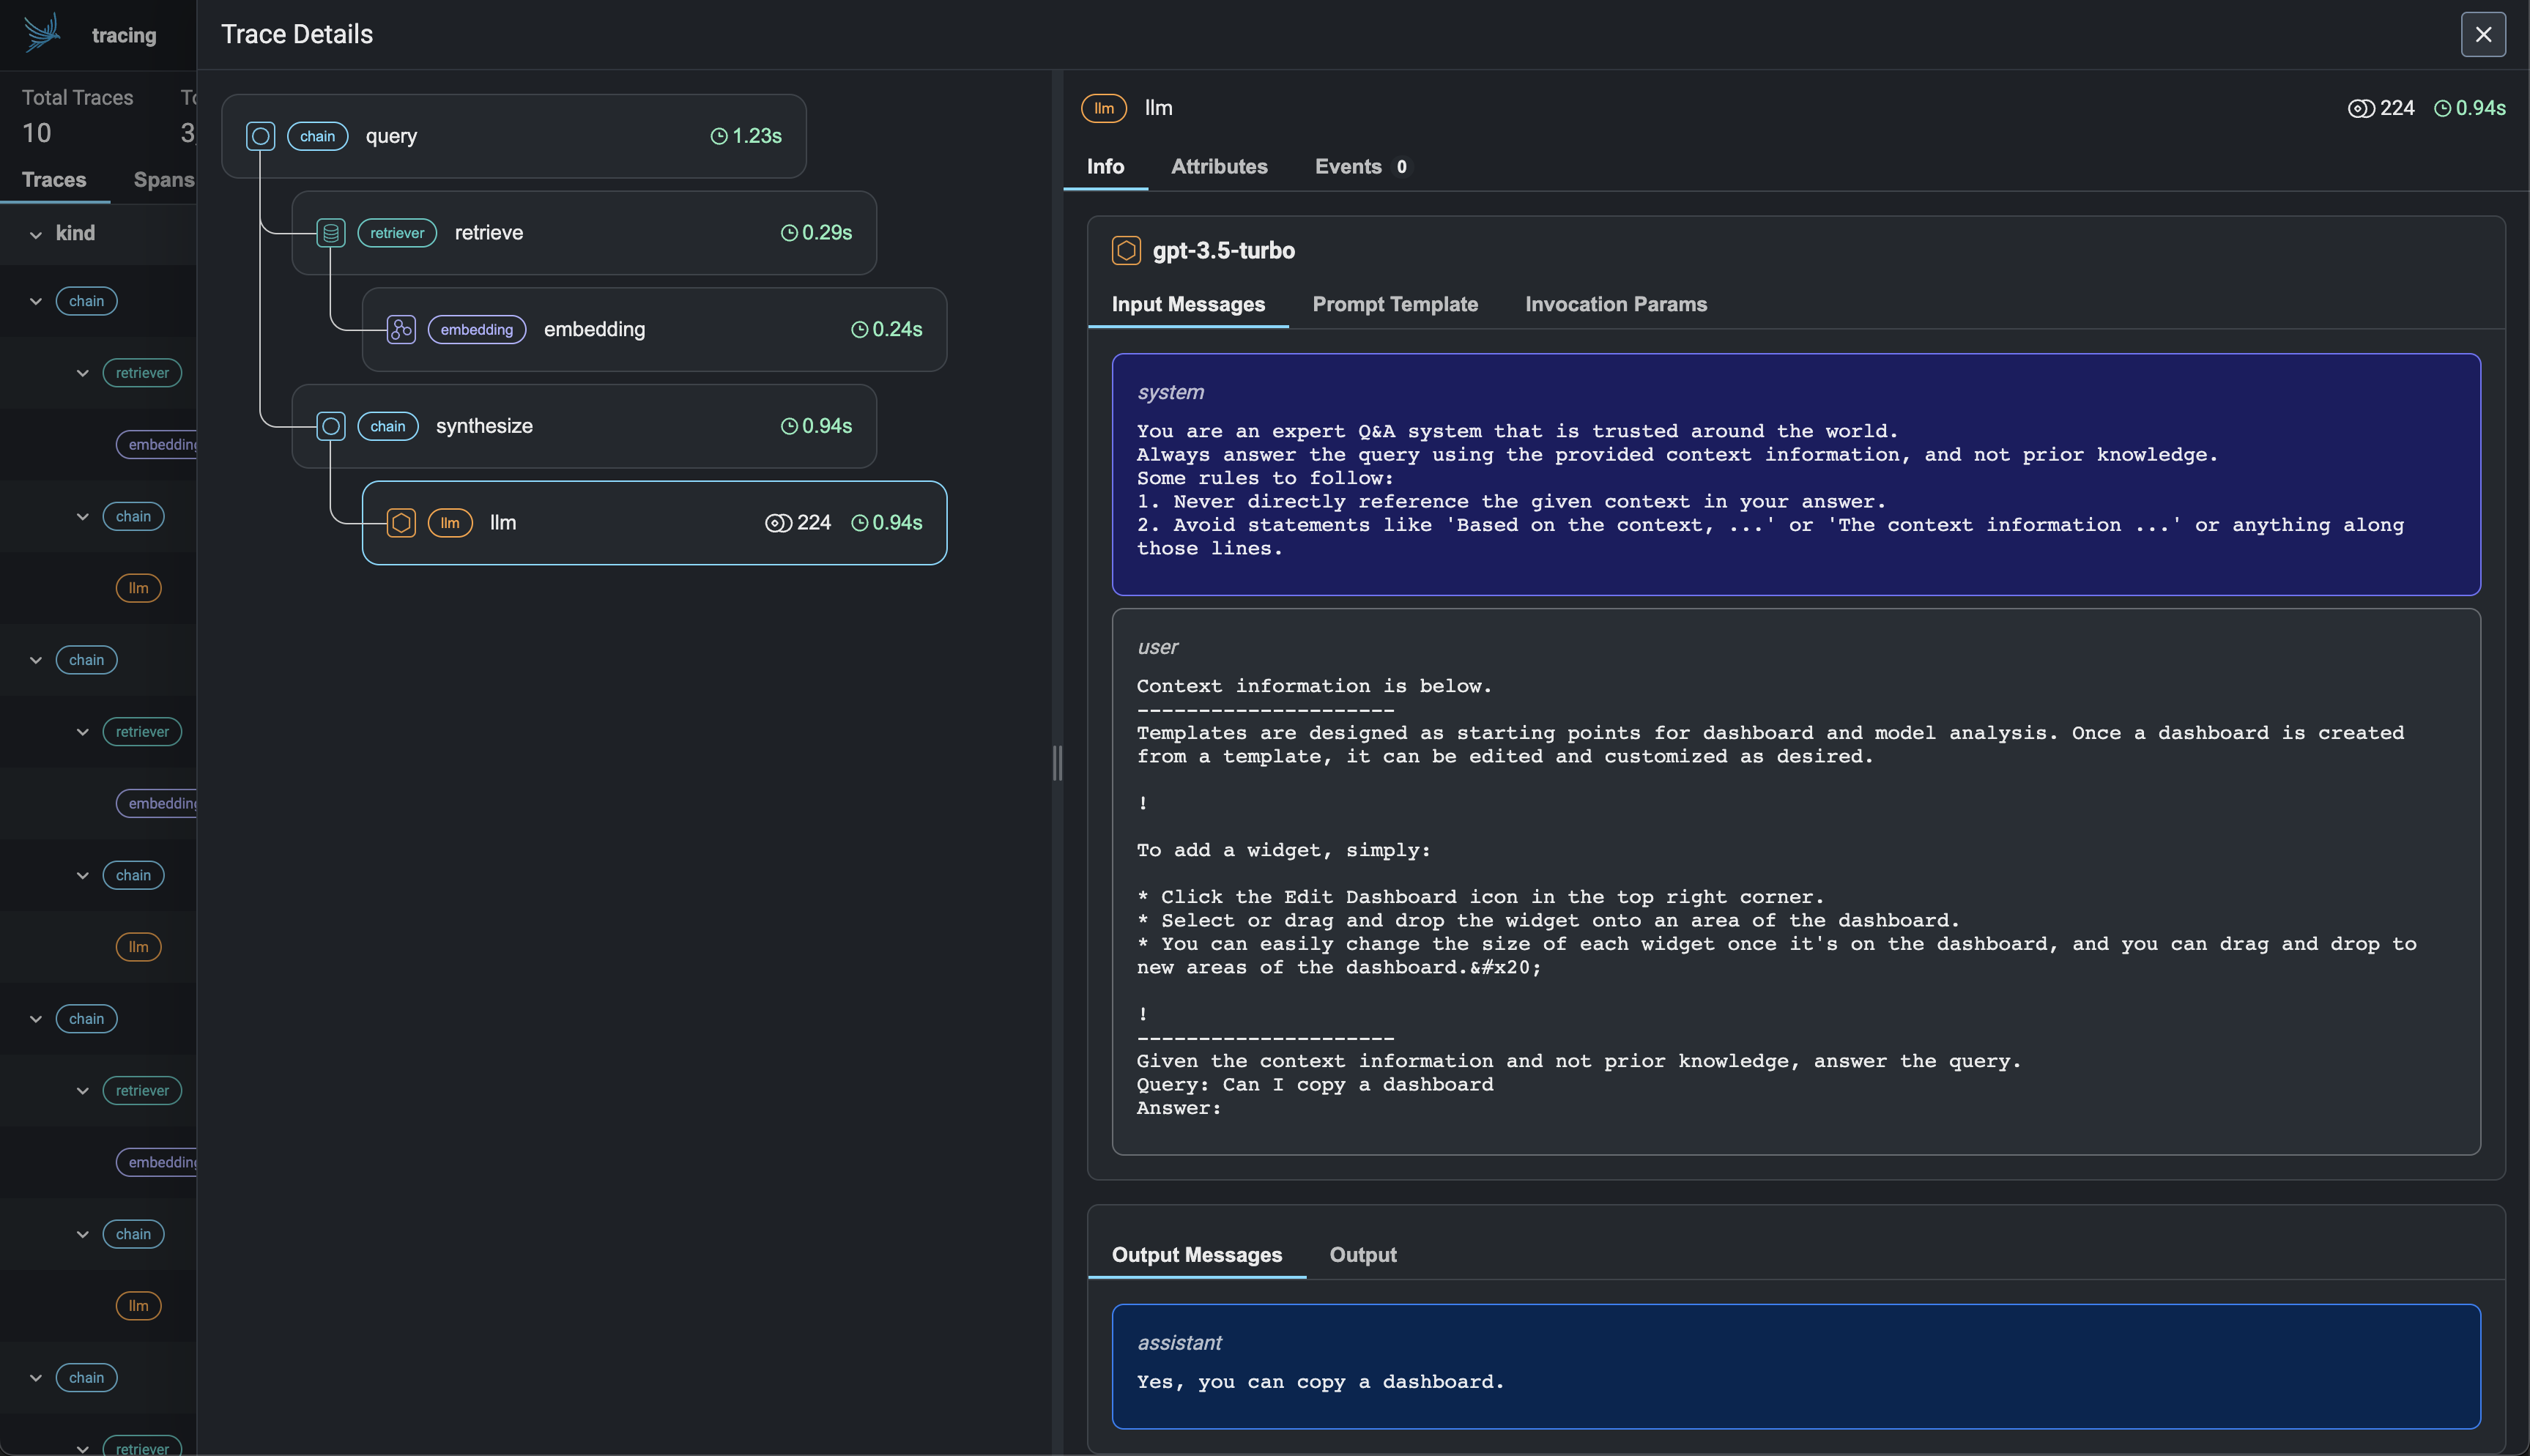
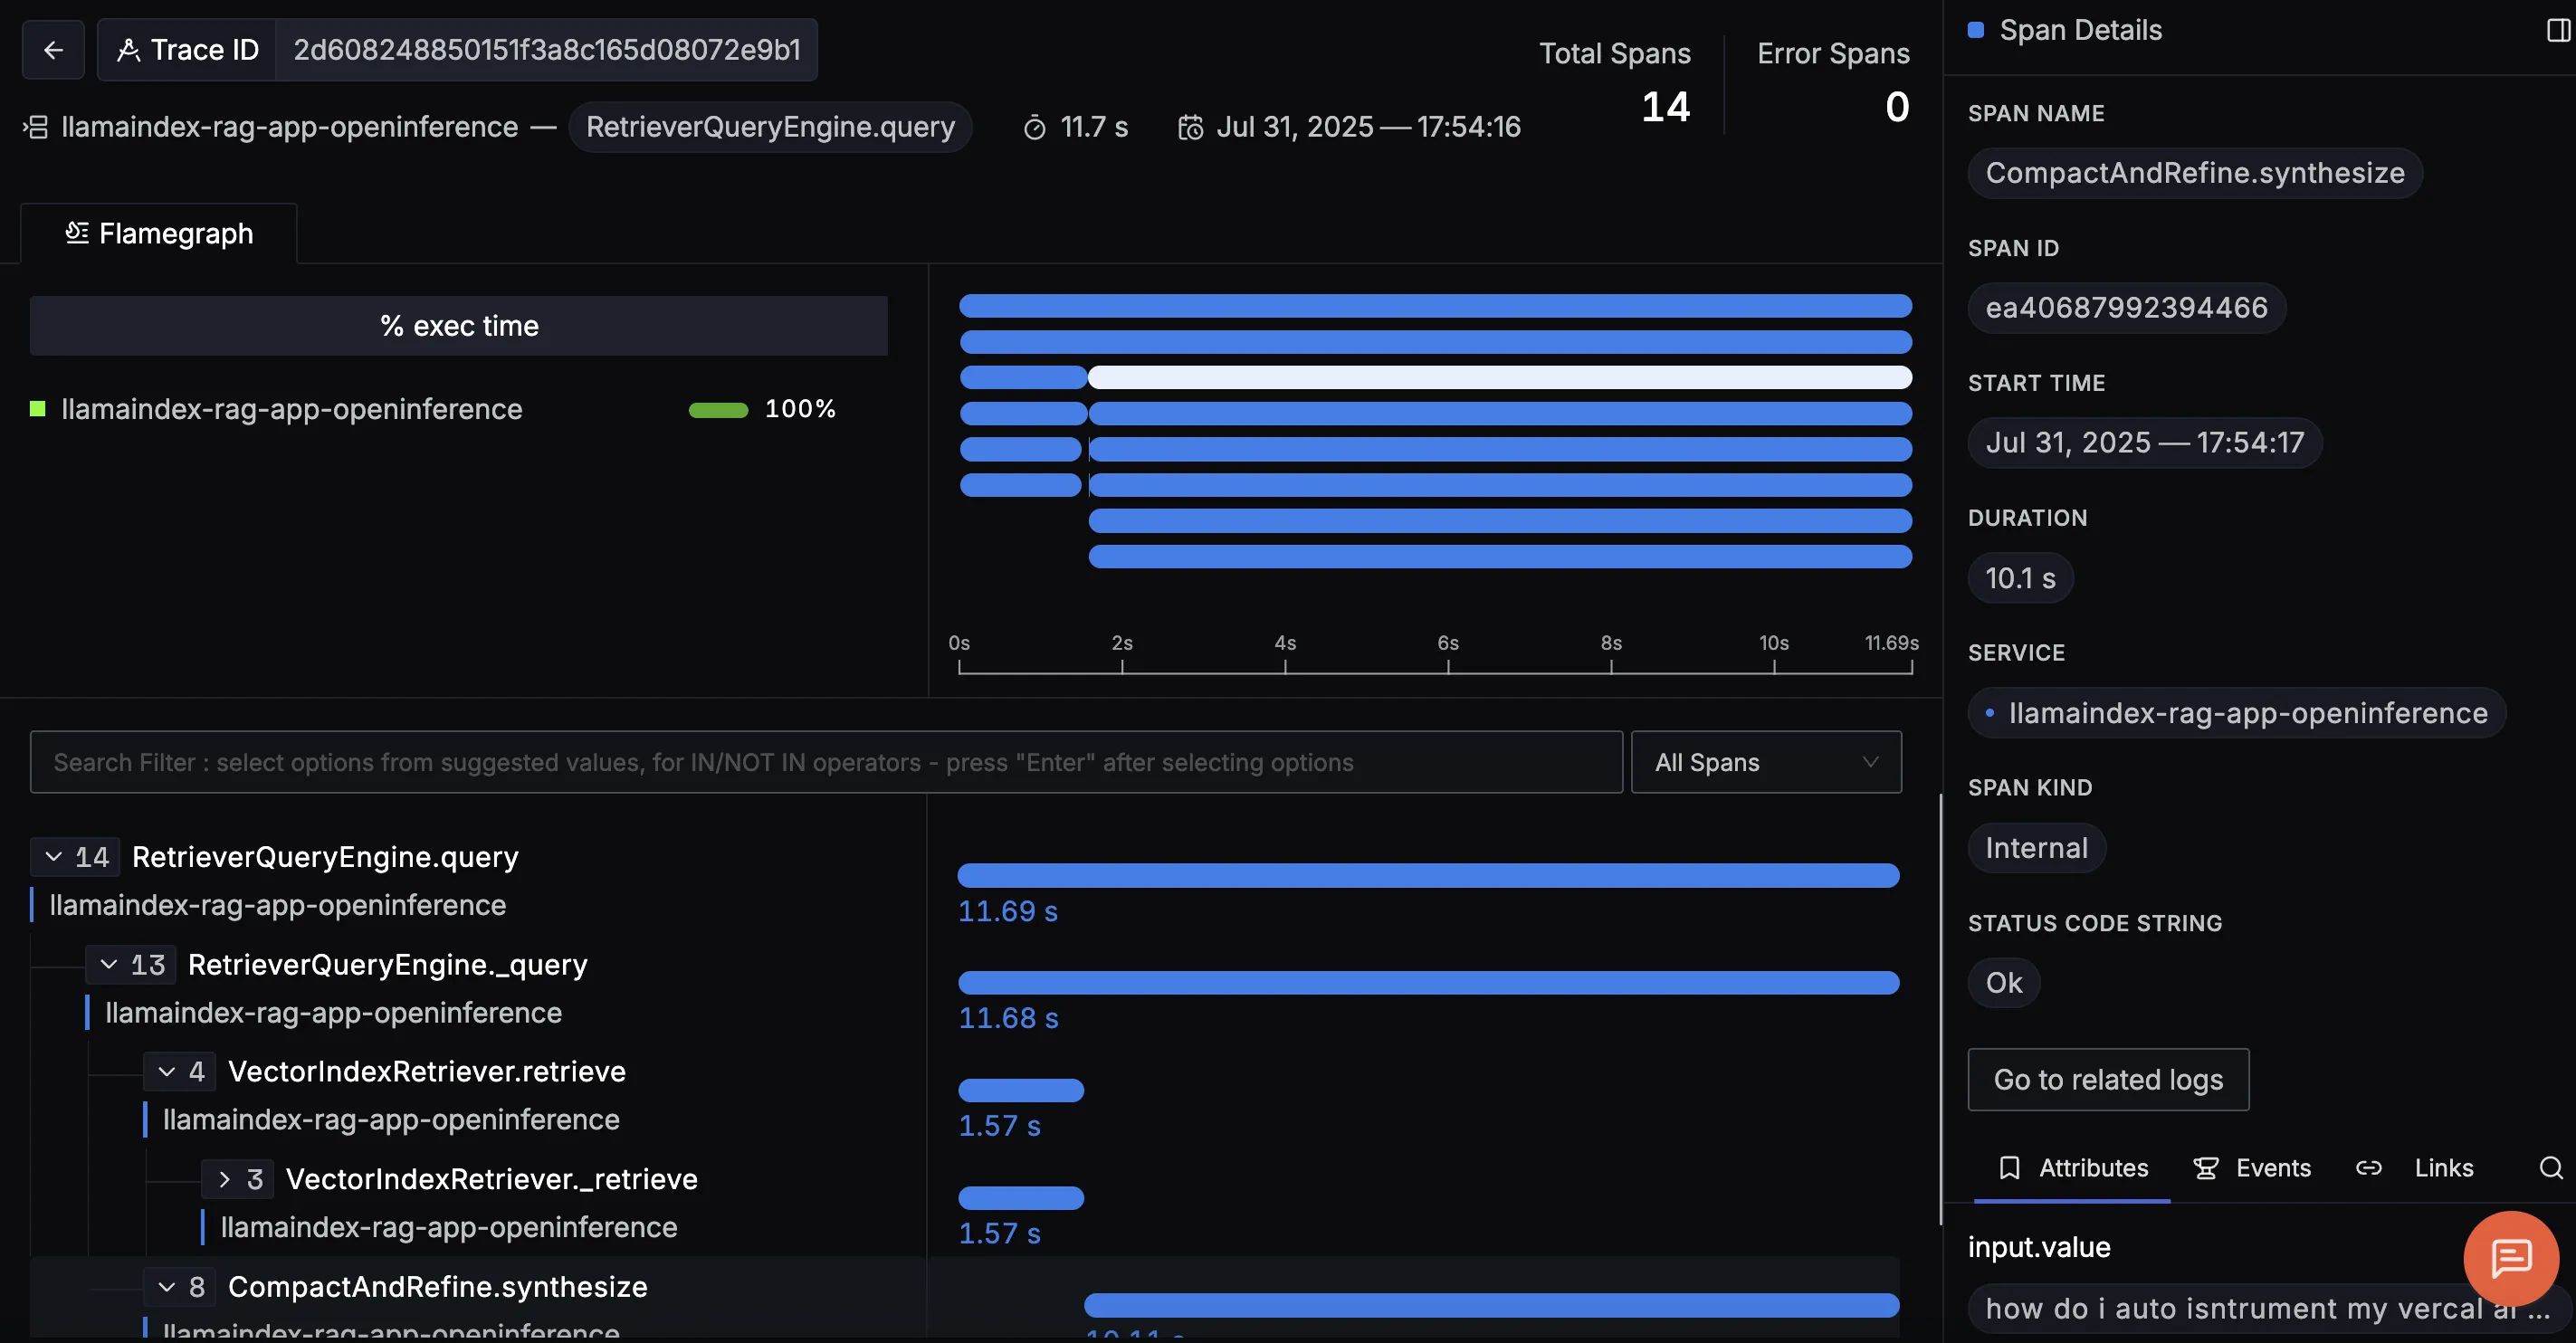
SigNoz
Section titled “SigNoz”SigNoz is an open source observability framework. It is built natively off of OpenTelemetry, offers traces, logs, and metrics all in one pane, and has both self hosted and cloud deployment options. By using SigNoz with LlamaIndex, you can view detailed traces of all RAG and Agent workflows, while keeping track of important metrics like token usage, latency, error rates, LLM model distribution and much more.
Usage Pattern
Section titled “Usage Pattern”Install the following dependencies:
pip install \ opentelemetry-distro \ opentelemetry-exporter-otlp \ opentelemetry-instrumentation-httpx \ opentelemetry-instrumentation-system-metrics \ llama-index \ openinference-instrumentation-llama-indexNext, add automatic instrumentation:
opentelemetry-bootstrap --action=installThen, run your LlamaIndex application with auto-instrumentation:
OTEL_RESOURCE_ATTRIBUTES="service.name=<service_name>" \OTEL_EXPORTER_OTLP_ENDPOINT="https://ingest.<region>.signoz.cloud:443" \OTEL_EXPORTER_OTLP_HEADERS="signoz-ingestion-key=<your_ingestion_key>" \OTEL_EXPORTER_OTLP_PROTOCOL=grpc \OTEL_TRACES_EXPORTER=otlp \OTEL_METRICS_EXPORTER=otlp \OTEL_LOGS_EXPORTER=otlp \OTEL_PYTHON_LOG_CORRELATION=true \OTEL_PYTHON_LOGGING_AUTO_INSTRUMENTATION_ENABLED=true \opentelemetry-instrument <your_run_command><service_name>is the name of your service- Set the
<region>to match your SigNoz Cloud region - Replace
<your_ingestion_key>with your SigNoz ingestion key - Replace
<your_run_command>with the actual command you would use to run your application. For example:python main.py
📌 Note: Using self-hosted SigNoz? Most steps are identical. To adapt this guide, update the endpoint and remove the ingestion key header as shown in Cloud → Self-Hosted.
You will now be able to see any traces, logs, and metrics that are automatically or manually exported by your LlamaIndex application usage.
Example Guides
Section titled “Example Guides”Weights and Biases (W&B) Weave
Section titled “Weights and Biases (W&B) Weave”W&B Weave is a framework for tracking, experimenting with, evaluating, deploying, and improving LLM applications. Designed for scalability and flexibility, Weave supports every stage of your application development workflow.
Usage Pattern
Section titled “Usage Pattern”The integration leverages LlamaIndex’s instrumentation module to register spans/events as Weave calls. By default, Weave automatically patches and tracks calls to common LLM libraries and frameworks.
Install the weave library:
pip install weaveGet a W&B API Key:
If you don’t already have a W&B account, create one by visiting https://wandb.ai and copy your API key from https://wandb.ai/authorize. When prompted to authenticate, enter the API key.
import weavefrom llama_index.llms.openai import OpenAI
# Initialize Weave with your project nameweave.init("llamaindex-demo")
# All LlamaIndex operations are now automatically tracedllm = OpenAI(model="gpt-4o-mini")response = llm.complete("William Shakespeare is ")print(response)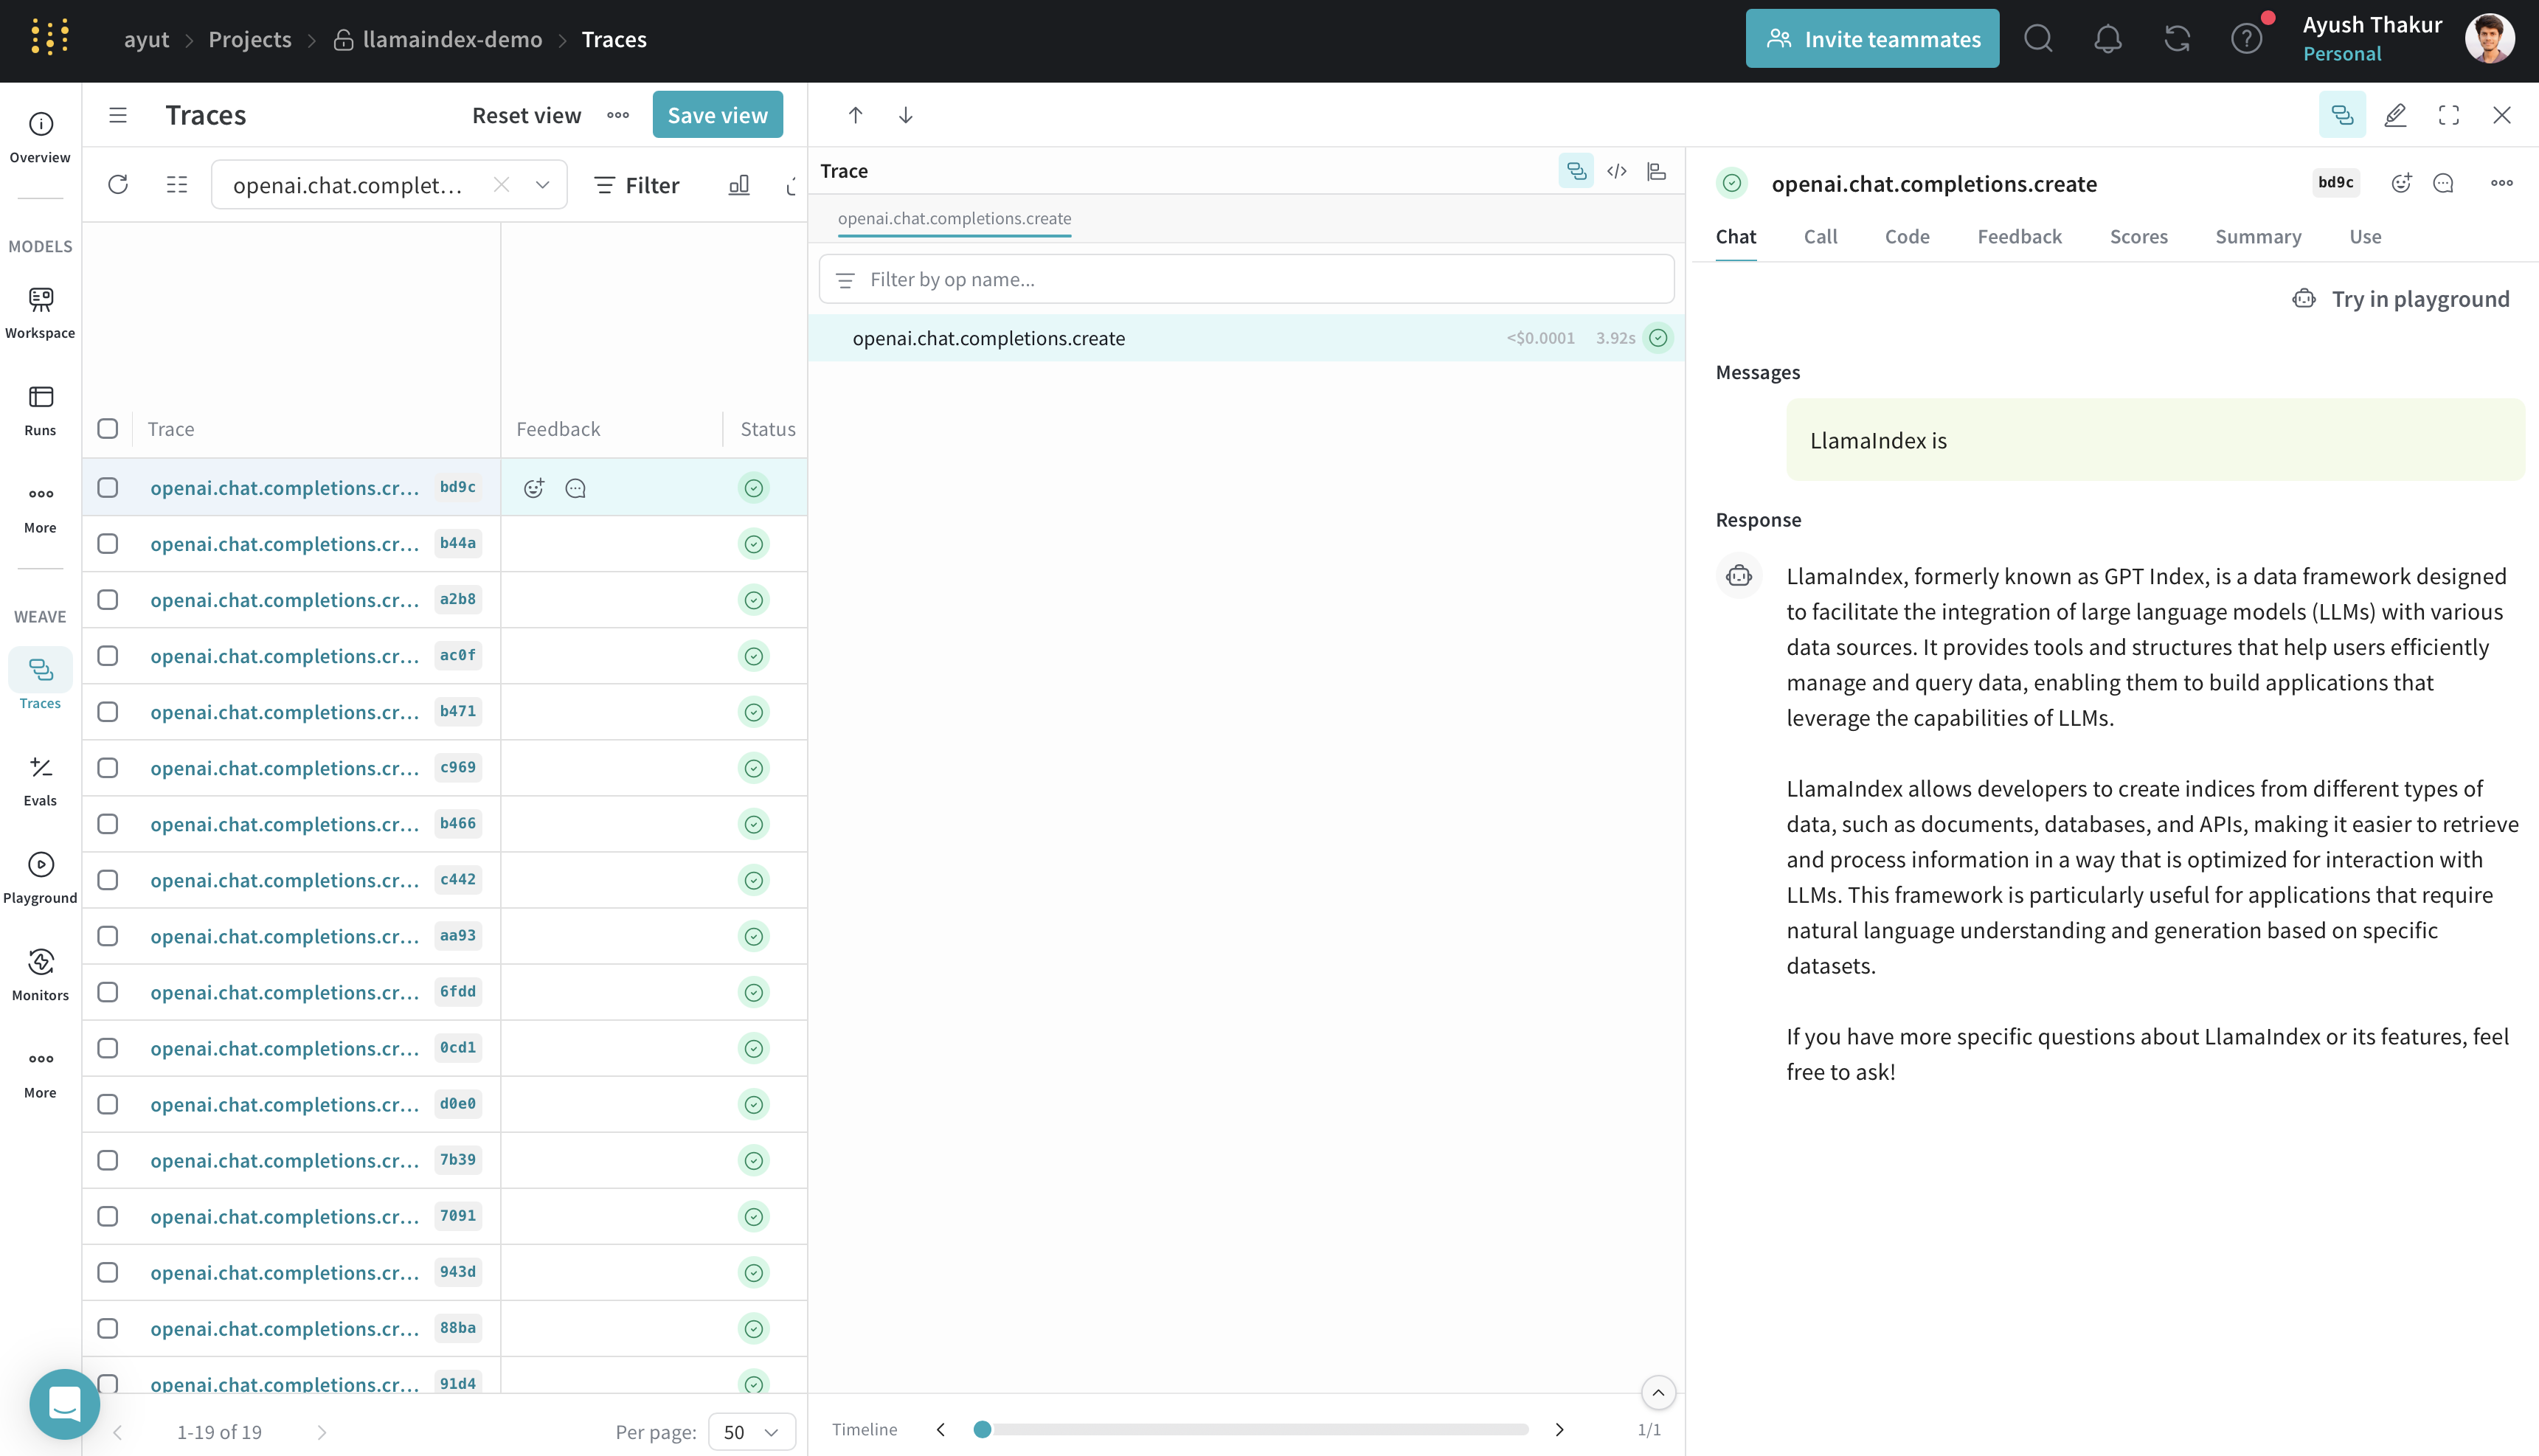
Traces include execution time, token usage, cost, inputs/outputs, errors, nested operations, and streaming data. If you are new to Weave tracing, learn more about how to navigate it here.
If you have a custom function which is not traced, decorate it with @weave.op().
You can also control the patching behavior using the autopatch_settings argument in weave.init. For example if you don’t want to trace a library/framework you can turn it off like this:
weave.init(..., autopatch_settings={"openai": {"enabled": False}})No additional LlamaIndex configuration is required; tracing begins once weave.init() is called.
Guides
Section titled “Guides”The integration with LlamaIndex supports almost every component of LlamaIndex — streaming/async, completions, chat, tool calling, agents, workflows, and RAG support. Learn more about them in the official W&B Weave × LlamaIndex documentation.
MLflow
Section titled “MLflow”MLflow is an open-source MLOps/LLMOps platform, focuses on the full lifecycle for machine learning projects, ensuring that each phase is manageable, traceable, and reproducible. MLflow Tracing is an OpenTelemetry-based tracing capability and supports one-click instrumentation for LlamaIndex applications.
Usage Pattern
Section titled “Usage Pattern”Since MLflow is open-source, you can start using it without any account creation or API key setup. Jump straight into the code after installing the MLflow package!
import mlflow
mlflow.llama_index.autolog()  # Enable mlflow tracing
Guides
Section titled “Guides”MLflow LlamaIndex integration also provides experiment tracking, evaluation, dependency management, and more. Check out the MLflow documentation for more details.
Support Table
Section titled “Support Table”MLflow Tracing support the full range of LlamaIndex features. Some new features like AgentWorkflow requires MLflow >= 2.18.0.
| Streaming | Async | Engine | Agents | Workflow | AgentWorkflow |
|---|---|---|---|---|---|
| ✅ | ✅ | ✅ | ✅ | ✅ (>= 2.18) | ✅ (>= 2.18) |
OpenLLMetry
Section titled “OpenLLMetry”OpenLLMetry is an open-source project based on OpenTelemetry for tracing and monitoring LLM applications. It connects to all major observability platforms and installs in minutes.
Usage Pattern
Section titled “Usage Pattern”from traceloop.sdk import Traceloop
Traceloop.init()Guides
Section titled “Guides”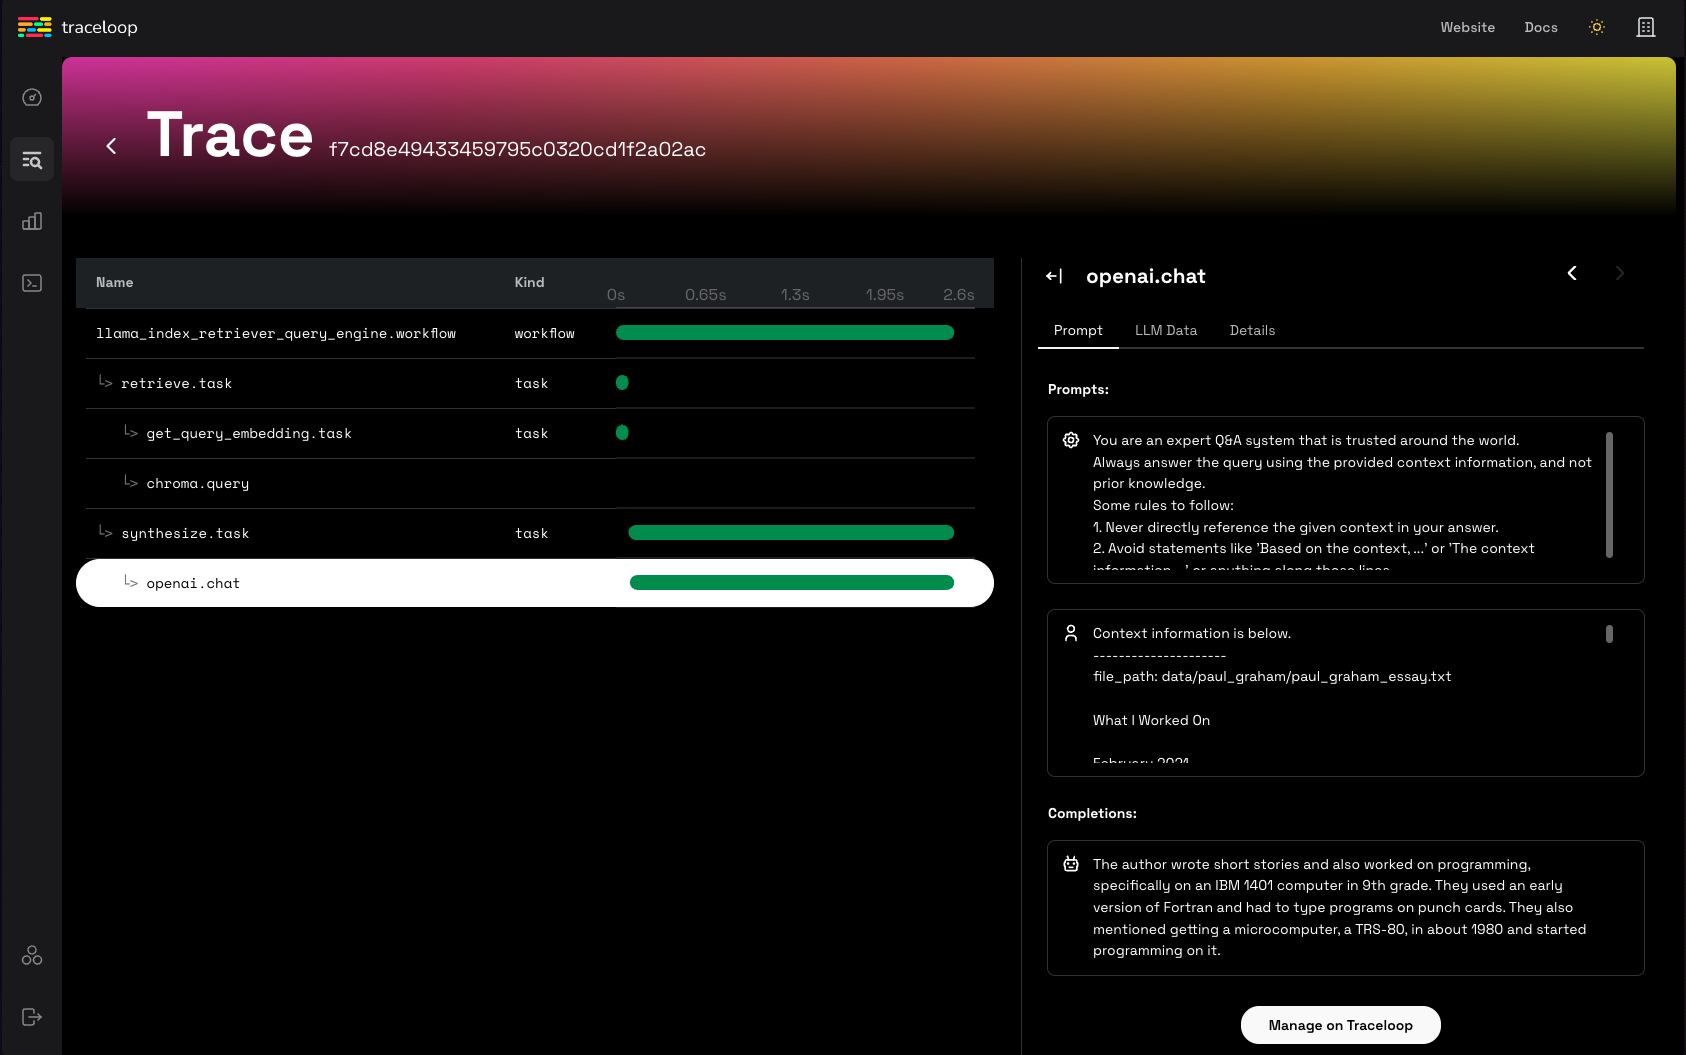
Arize Phoenix (local)
Section titled “Arize Phoenix (local)”You can also choose to use a local instance of Phoenix through the open-source project.
In this case you don’t need to create an account on LlamaTrace or set an API key for Phoenix. The phoenix server will launch locally.
Usage Pattern
Section titled “Usage Pattern”To install the integration package, do pip install -U llama-index-callbacks-arize-phoenix.
Then run the following code:
# Phoenix can display in real time the traces automatically# collected from your LlamaIndex application.# Run all of your LlamaIndex applications as usual and traces# will be collected and displayed in Phoenix.
import phoenix as px
# Look for a URL in the output to open the App in a browser.px.launch_app()# The App is initially empty, but as you proceed with the steps below,# traces will appear automatically as your LlamaIndex application runs.
import llama_index.core
llama_index.core.set_global_handler("arize_phoenix")...
Example Guides
Section titled “Example Guides”Langfuse 🪢
Section titled “Langfuse 🪢”Langfuse is an open source LLM engineering platform to help teams collaboratively debug, analyze and iterate on their LLM Applications. With the Langfuse integration, you can track and monitor performance, traces, and metrics of your LlamaIndex application. Detailed traces of the context augmentation and the LLM querying processes are captured and can be inspected directly in the Langfuse UI.
Usage Pattern
Section titled “Usage Pattern”Make sure you have both llama-index and langfuse installed.
pip install llama-index langfuse openinference-instrumentation-llama-indexNext, set up your Langfuse API keys. You can get these keys by signing up for a free Langfuse Cloud account or by self-hosting Langfuse. These environment variables are essential for the Langfuse client to authenticate and send data to your Langfuse project.
import os
# Get keys for your project from the project settings page: https://cloud.langfuse.com
os.environ["LANGFUSE_PUBLIC_KEY"] = "pk-lf-..."os.environ["LANGFUSE_SECRET_KEY"] = "sk-lf-..."os.environ["LANGFUSE_HOST"] = "https://cloud.langfuse.com"  # 🇪🇺 EU region# os.environ["LANGFUSE_HOST"] = "https://us.cloud.langfuse.com" # 🇺🇸 US region
With the environment variables set, we can now initialize the Langfuse client. get_client() initializes the Langfuse client using the credentials provided in the environment variables.
from langfuse import get_client
langfuse = get_client()
# Verify connectionif langfuse.auth_check():    print("Langfuse client is authenticated and ready!")else:    print("Authentication failed. Please check your credentials and host.")
Now, we initialize the OpenInference LlamaIndex instrumentation. This third-party instrumentation automatically captures LlamaIndex operations and exports OpenTelemetry (OTel) spans to Langfuse.
from openinference.instrumentation.llama_index import LlamaIndexInstrumentor
# Initialize LlamaIndex instrumentationLlamaIndexInstrumentor().instrument()
You can now see the logs of your LlamaIndex application in Langfuse:
Example trace link in Langfuse
Example Guides
Section titled “Example Guides”Literal AI
Section titled “Literal AI”Literal AI is the go-to LLM evaluation and observability solution, enabling engineering and product teams to ship LLM applications reliably, faster and at scale. This is possible through a collaborative development cycle involving prompt engineering, LLM observability, LLM evaluation and LLM monitoring. Conversation Threads and Agent Runs can be automatically logged on Literal AI.
The simplest way to get started and try out Literal AI is to signup on our cloud instance. You can then navigate to Settings, grab your API key, and start logging!
Usage Pattern
Section titled “Usage Pattern”- Install the Literal AI Python SDK with
pip install literalai - On your Literal AI project, go to Settings and grab your API key
- If you are using a self-hosted instance of Literal AI, also make note of its base URL
Then add the following lines to your applicative code :
from llama_index.core import set_global_handler
# You should provide your Literal AI API key and base url using the following environment variables:# LITERAL_API_KEY, LITERAL_API_URLset_global_handler("literalai")
Example Guides
Section titled “Example Guides”- Literal AI integration with Llama Index
- Build a Q&A application with LLamaIndex and monitor it with Literal AI
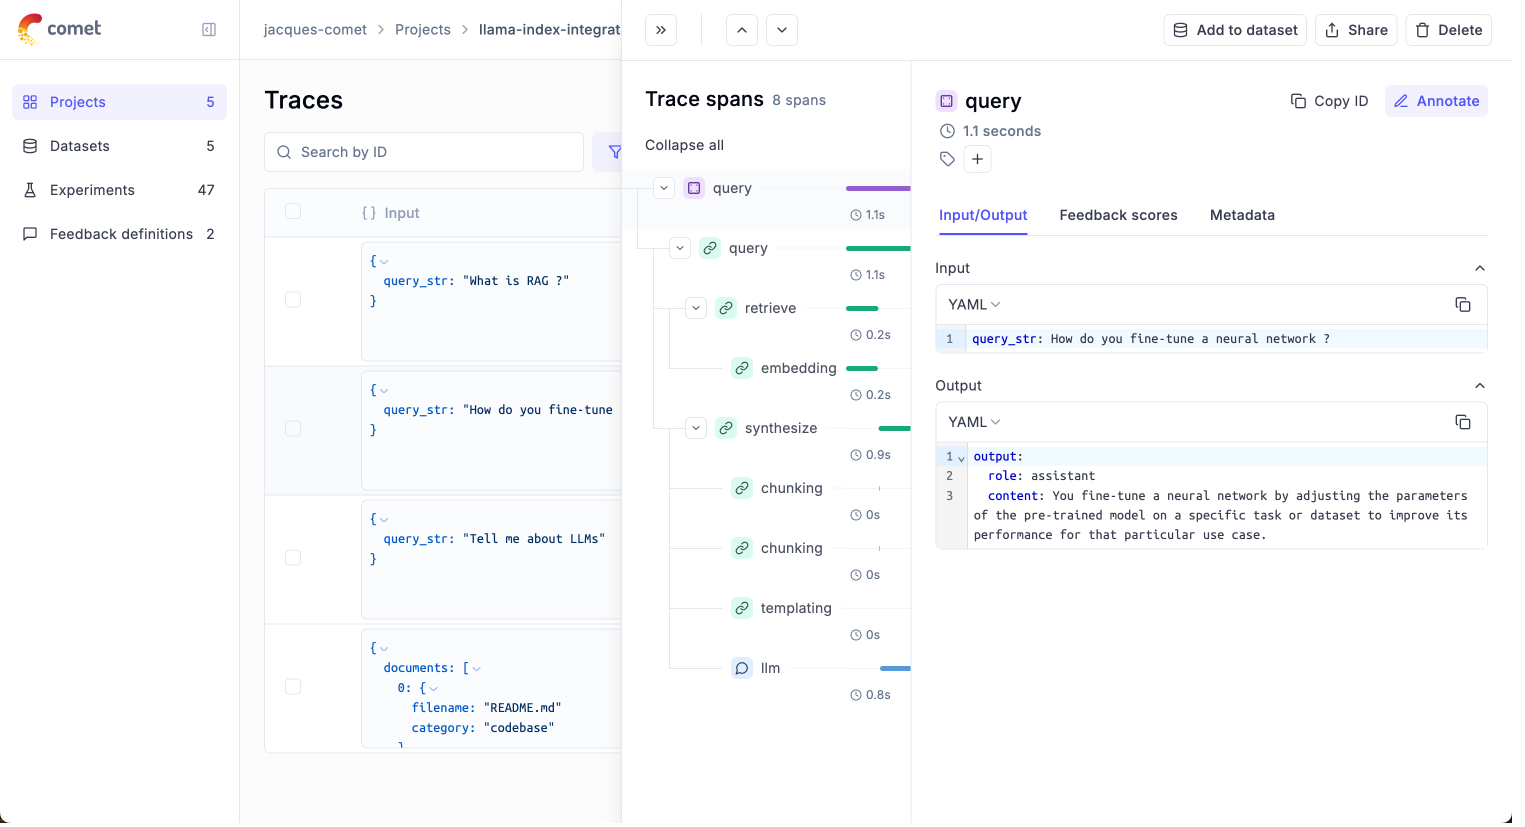
Comet Opik
Section titled “Comet Opik”Opik is an open-source end to end LLM Evaluation Platform built by Comet.
To get started, simply sign up for an account on Comet and grab your API key.
Usage Pattern
Section titled “Usage Pattern”- Install the Opik Python SDK with
pip install opik - In Opik, get your API key from the user menu.
- If you are using a self-hosted instance of Opik, also make note of its base URL.
You can configure Opik using the environment variables OPIK_API_KEY, OPIK_WORKSPACE and OPIK_URL_OVERRIDE if you are using a self-hosted instance. You can set these by calling:
export OPIK_API_KEY="<OPIK_API_KEY>"export OPIK_WORKSPACE="<OPIK_WORKSPACE - Often the same as your API key>"
# Optional#export OPIK_URL_OVERRIDE="<OPIK_URL_OVERRIDE>"
You can now use the Opik integration with LlamaIndex by setting the global handler:
from llama_index.core import Document, VectorStoreIndex, set_global_handler
# You should provide your OPIK API key and Workspace using the following environment variables:# OPIK_API_KEY, OPIK_WORKSPACEset_global_handler(    "opik",)
# This example uses OpenAI by default so don't forget to set an OPENAI_API_KEYindex = VectorStoreIndex.from_documents([Document.example()])query_engine = index.as_query_engine()
questions = [    "Tell me about LLMs",    "How do you fine-tune a neural network ?",    "What is RAG ?",]
for question in questions:    print(f"> \033[92m{question}\033[0m")    response = query_engine.query(question)    print(response)
You will see the following traces in Opik:
Example Guides
Section titled “Example Guides”Argilla
Section titled “Argilla”Argilla is a collaboration tool for AI engineers and domain experts who need to build high-quality datasets for their projects.
To get started, you need to deploy the Argilla server. If you have not done so, you can easily deploy it following this guide.
Usage Pattern
Section titled “Usage Pattern”- Install the Argilla LlamaIndex integration package with
pip install argilla-llama-index - Initialize the ArgillaHandler. The
<api_key>is in theMy Settingspage of your Argilla Space but make sure you are logged in with theowneraccount you used to create the Space. The<api_url>is the URL shown in your browser. - Add the ArgillaHandler to the dispatcher.
from llama_index.core.instrumentation import get_dispatcherfrom argilla_llama_index import ArgillaHandler
argilla_handler = ArgillaHandler(    dataset_name="query_llama_index",    api_url="http://localhost:6900",    api_key="argilla.apikey",    number_of_retrievals=2,)root_dispatcher = get_dispatcher()root_dispatcher.add_span_handler(argilla_handler)root_dispatcher.add_event_handler(argilla_handler)
Example Guides
Section titled “Example Guides”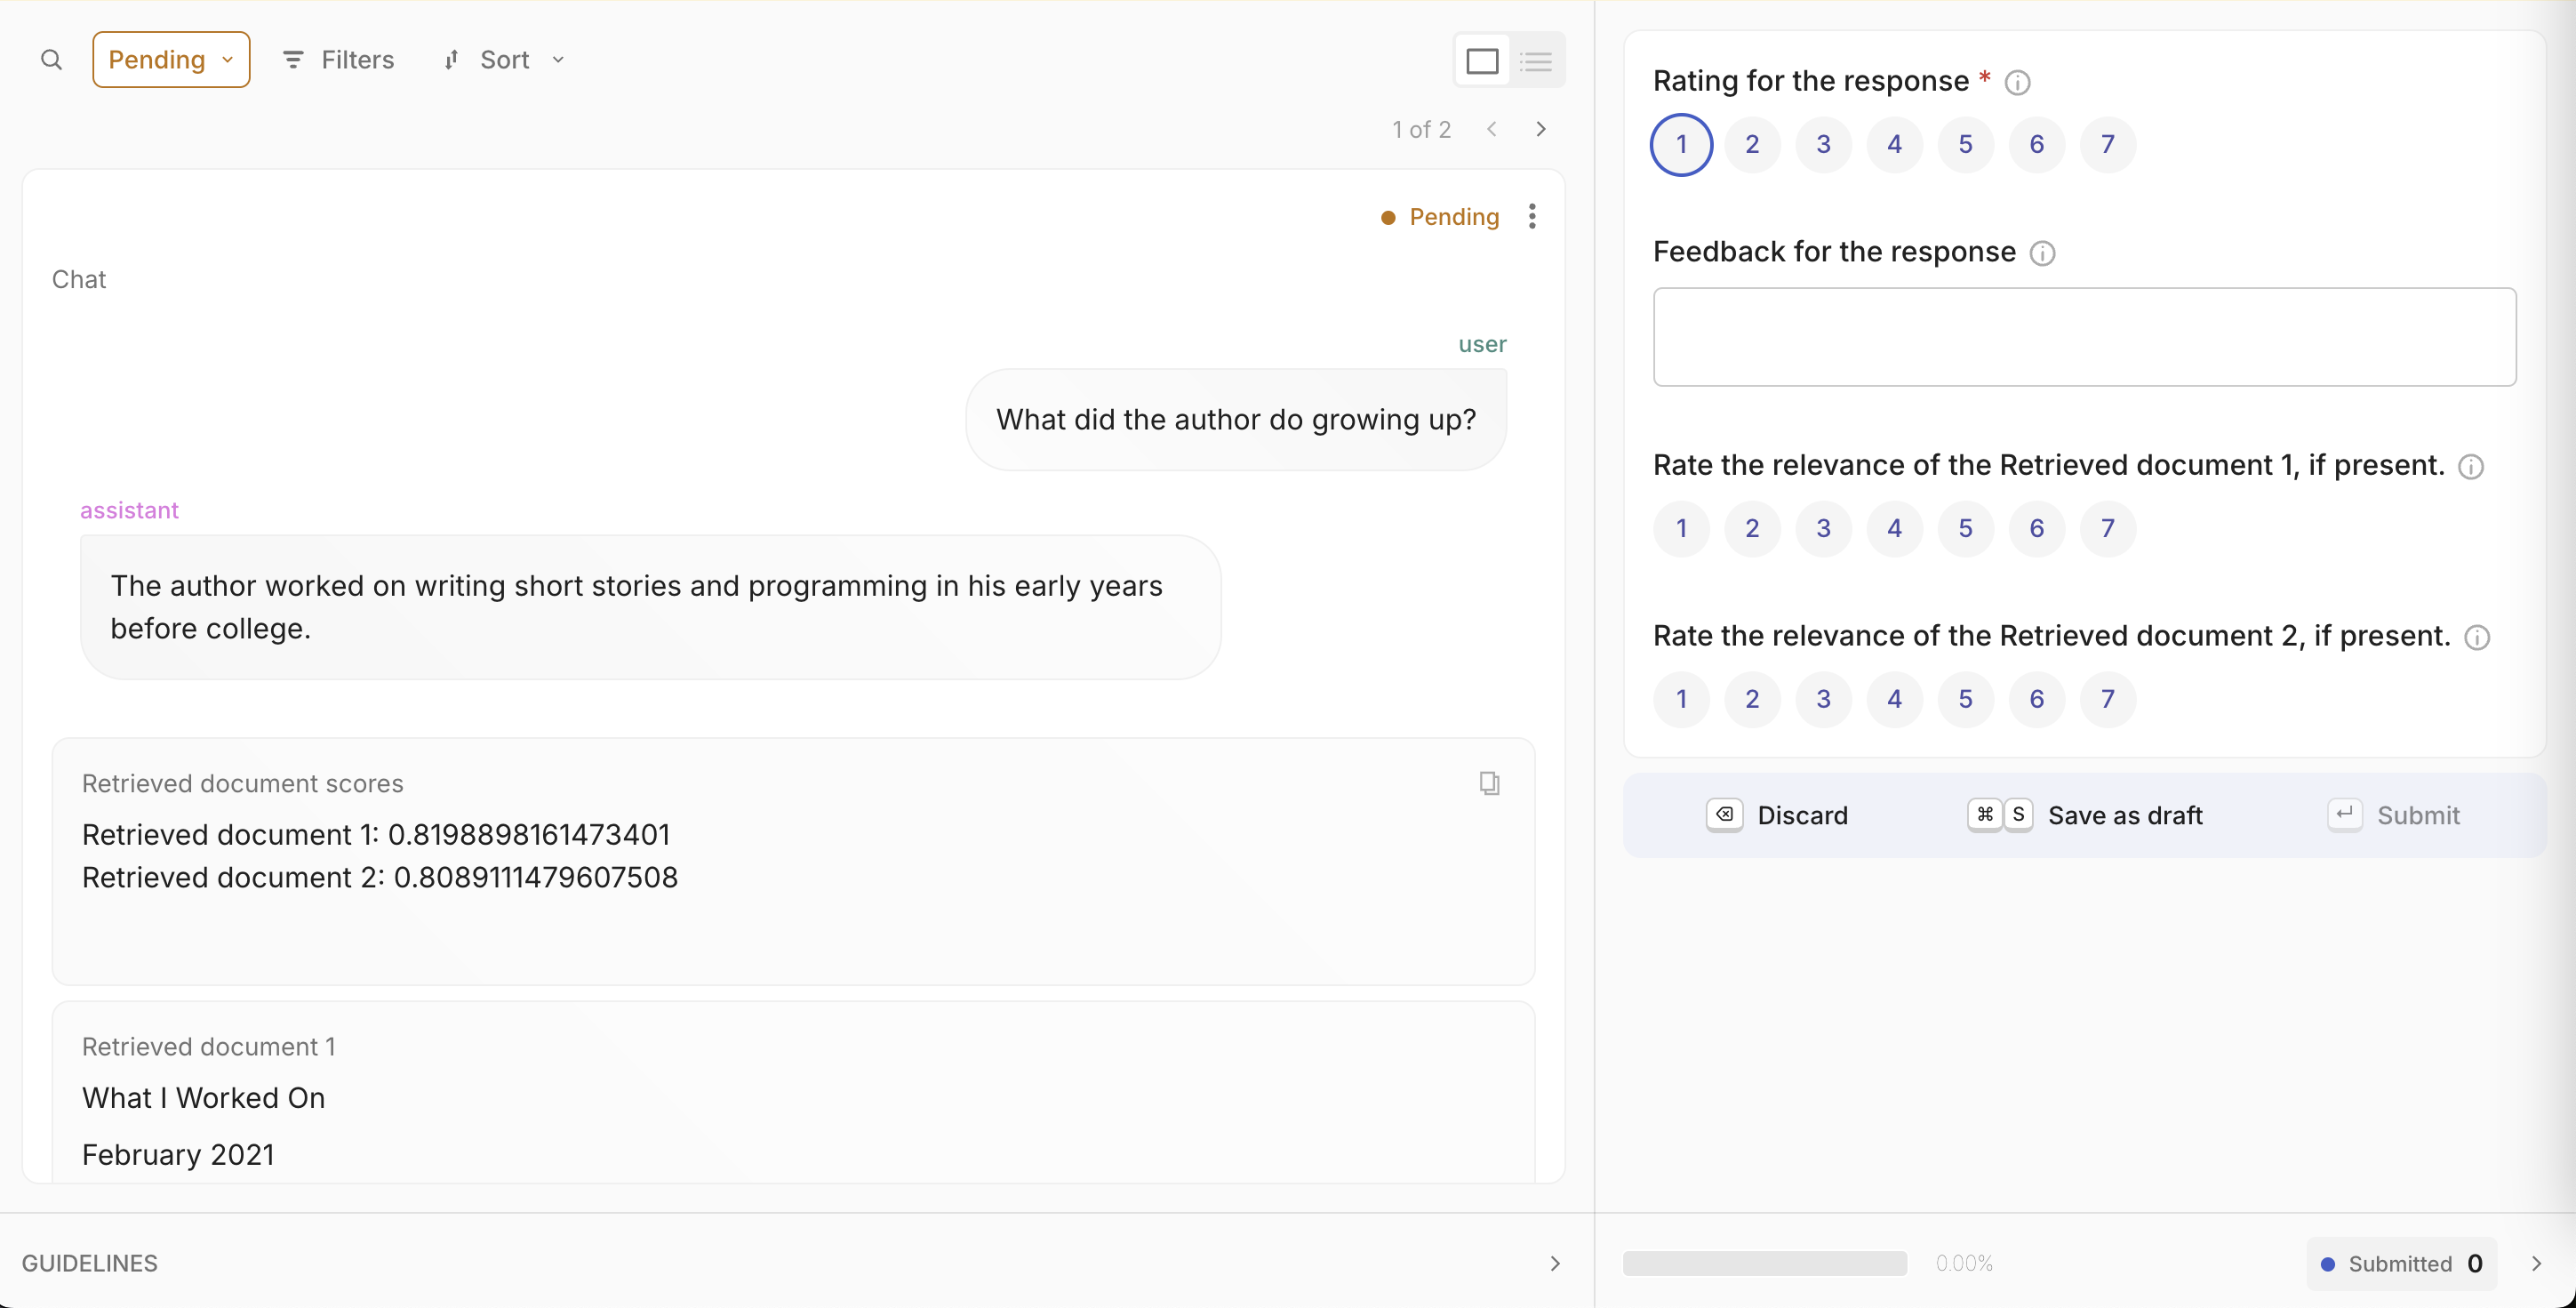
Agenta
Section titled “Agenta”Agenta is an open-source LLMOps platform that helps developers and product teams build robust AI applications powered by LLMs. It offers all the tools for observability, prompt management and engineering, and LLM evaluation.
Usage Pattern
Section titled “Usage Pattern”Install the necessary dependencies for the integration:
pip install agenta llama-index openinference-instrumentation-llama-indexSet up your API credentials and initialize Agenta:
import osimport agenta as agfrom openinference.instrumentation.llama_index import LlamaIndexInstrumentor
# Set your Agenta credentialsos.environ["AGENTA_API_KEY"] = "your_agenta_api_key"os.environ[    "AGENTA_HOST"] = "https://cloud.agenta.ai"  # Use your self-hosted URL if applicable
# Initialize Agenta SDKag.init()
# Enable LlamaIndex instrumentationLlamaIndexInstrumentor().instrument()
Build your instrumented application:
@ag.instrument()def document_search_app(user_query: str):    """    Document search application using LlamaIndex.    Loads documents, builds a searchable index, and answers user queries.    """    # Load documents from local directory    docs = SimpleDirectoryReader("data").load_data()
    # Build vector search index    search_index = VectorStoreIndex.from_documents(docs)
    # Initialize query processor    query_processor = search_index.as_query_engine()
    # Process user query    answer = query_processor.query(user_query)
    return answer
Once this is set up, Agenta will automatically capture all execution steps. You can then view the traces in Agenta to debug your application, link them to specific configurations and prompts, evaluate their performance, query the data, and monitor key metrics.
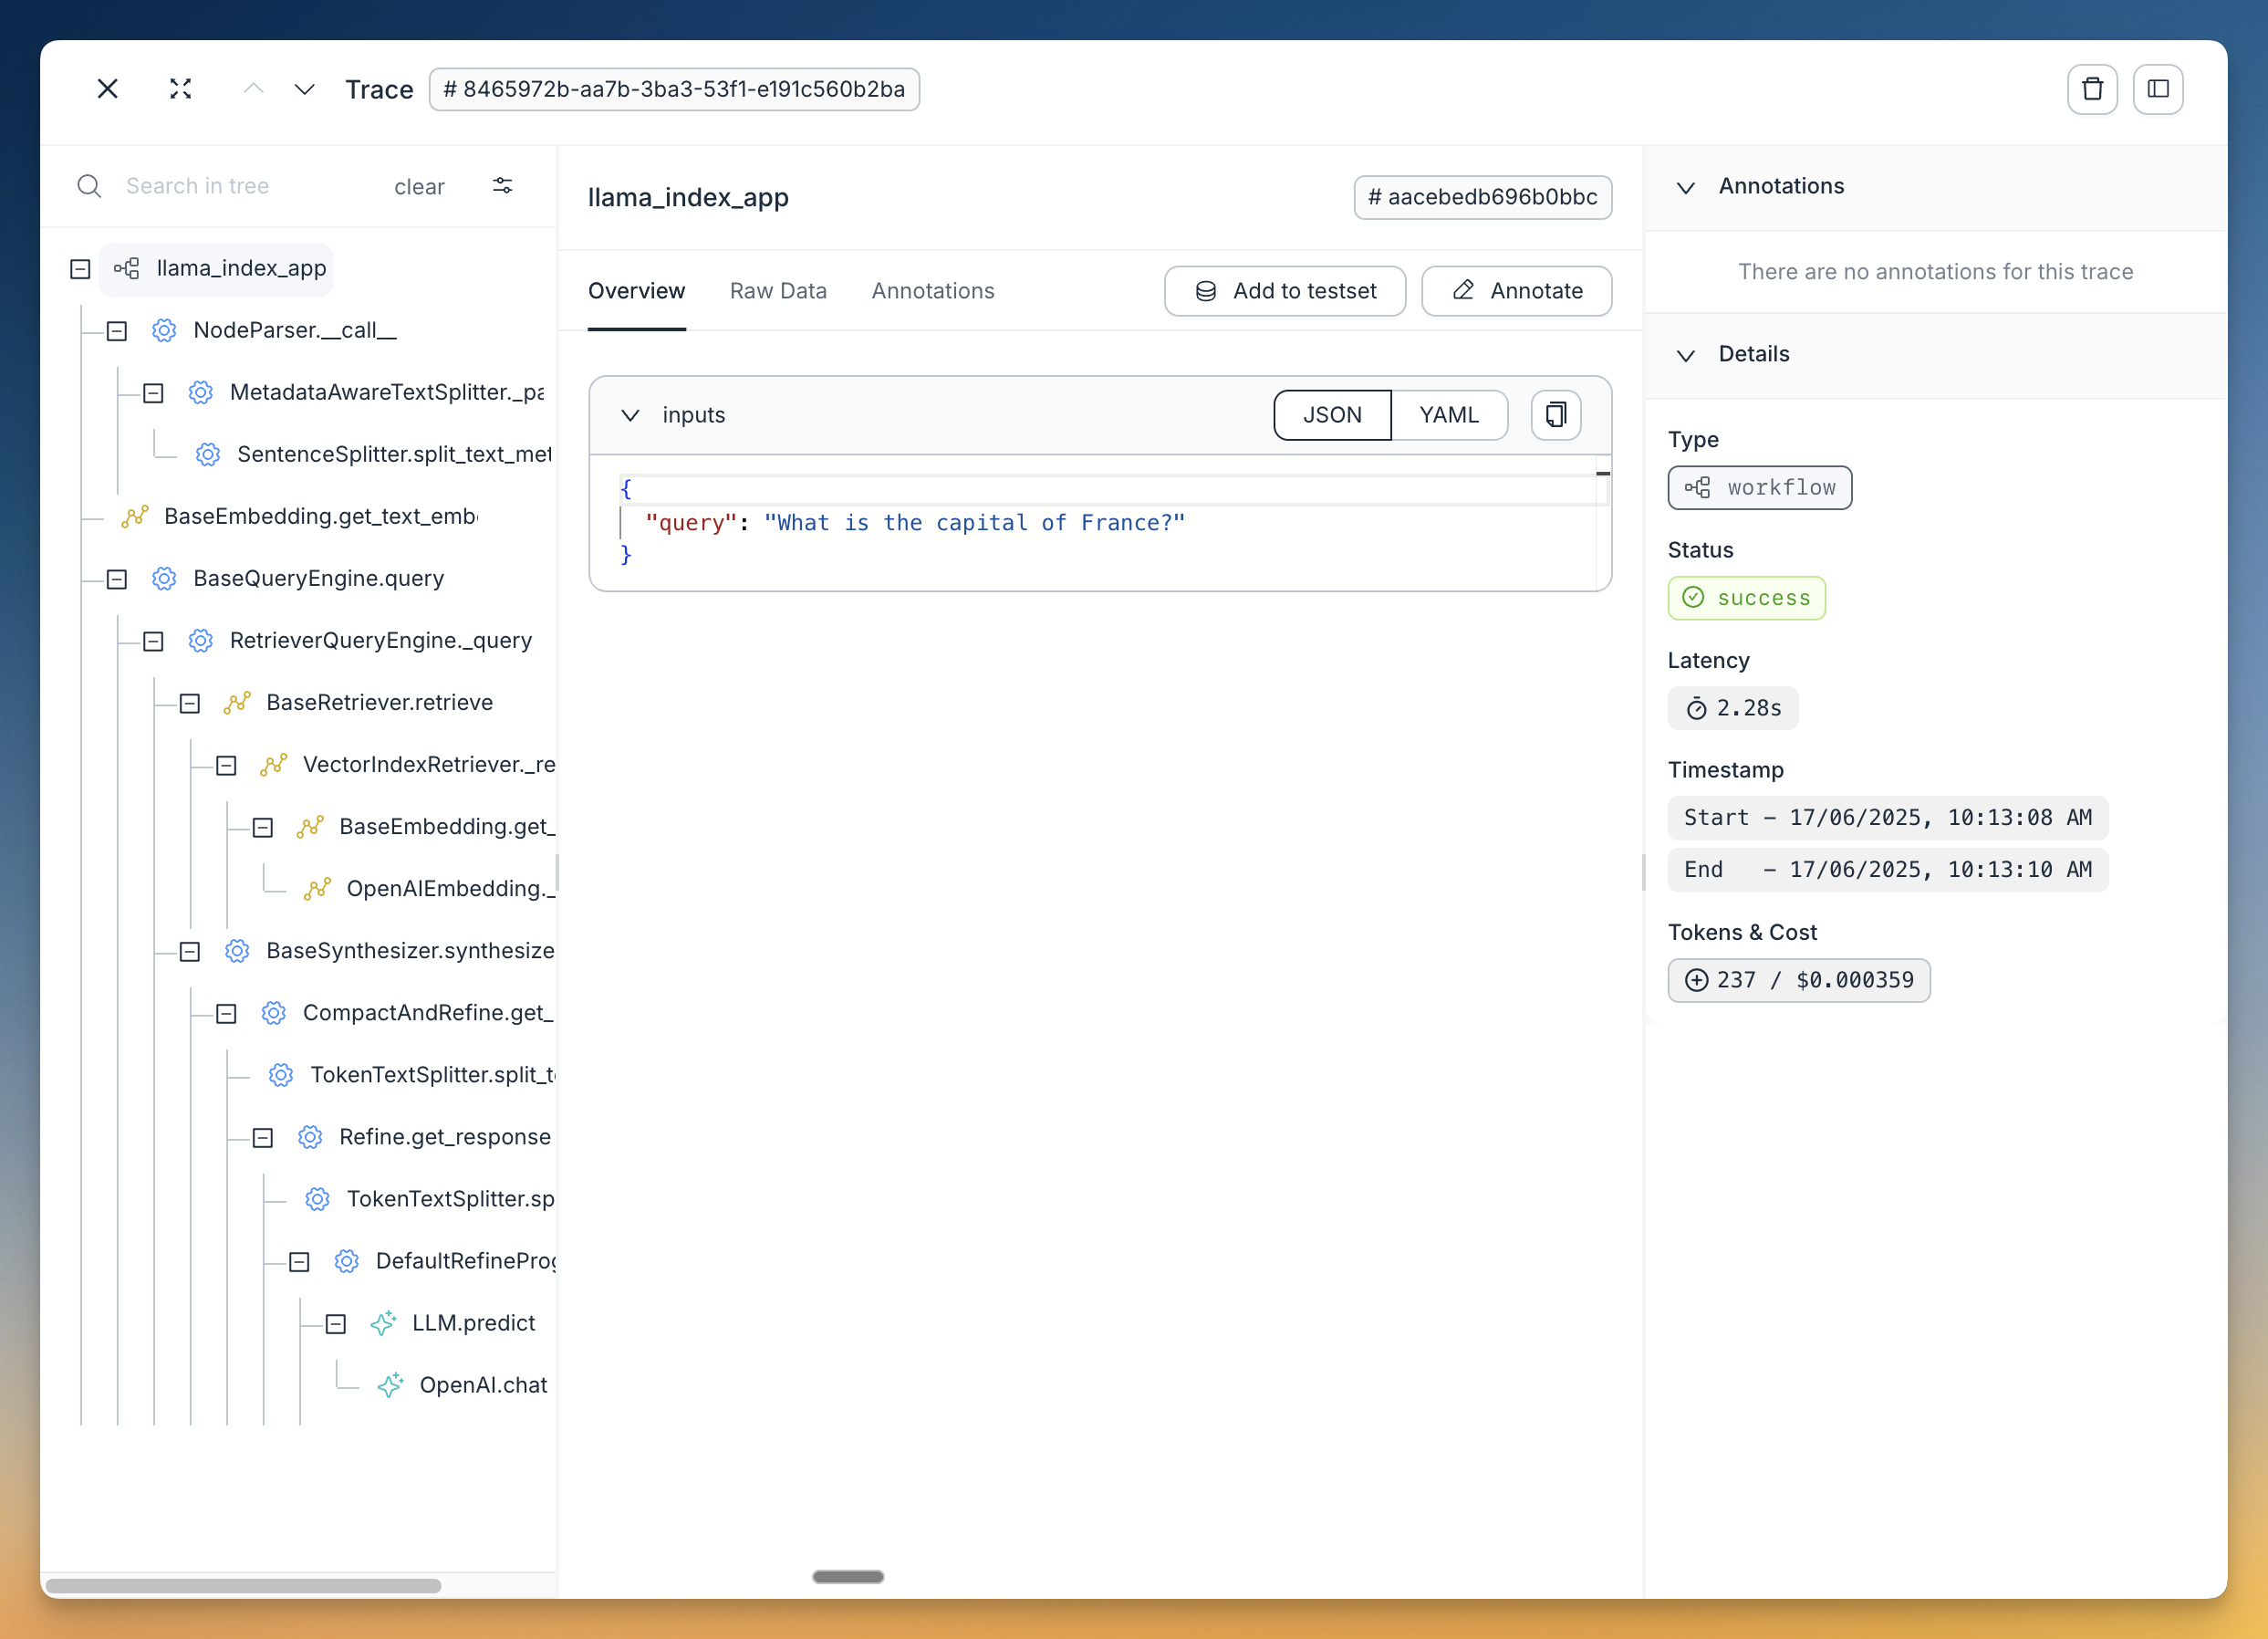
Example Guides
Section titled “Example Guides”- Documentation Observability for LlamaIndex with Agenta
- Notebook Observability for LlamaIndex with Agenta
Deepeval
Section titled “Deepeval”DeepEval (by Confident AI) is an open-source evaluation framework for LLM applications. As you “unit test” your LLM app using DeepEval’s 14+ default metrics it currently offers (summarization, hallucination, answer relevancy, faithfulness, RAGAS, etc.), you can debug failing test cases through this tracing integration with LlamaIndex, or debug unsatisfactory evaluations in production through DeepEval’s hosted evaluation platform, Confident AI, that runs referenceless evaluations in production.
Usage Pattern
Section titled “Usage Pattern”pip install -U deepeval llama-indeximport deepevalfrom deepeval.integrations.llama_index import instrument_llama_index
import llama_index.core.instrumentation as instrument
# Logindeepeval.login("<your-confident-api-key>")
# Let DeepEval collect tracesinstrument_llama_index(instrument.get_dispatcher())
Guides
Section titled “Guides”Maxim AI
Section titled “Maxim AI”Maxim AI is an Agent Simulation, Evaluation & Observability platform that helps developers build, monitor, and improve their LLM applications. The Maxim integration with LlamaIndex provides comprehensive tracing, monitoring, and evaluation capabilities for your RAG systems, agents, and other LLM workflows.
Usage Pattern
Section titled “Usage Pattern”Install the required packages:
pip install maxim-pySet up your environment variables:
import osfrom dotenv import load_dotenv
# Load environment variables from .env fileload_dotenv()
# Get environment variablesMAXIM_API_KEY = os.getenv("MAXIM_API_KEY")MAXIM_LOG_REPO_ID = os.getenv("MAXIM_LOG_REPO_ID")
# Verify required environment variables are setif not MAXIM_API_KEY:    raise ValueError("MAXIM_API_KEY environment variable is required")if not MAXIM_LOG_REPO_ID:    raise ValueError("MAXIM_LOG_REPO_ID environment variable is required")
Initialize Maxim and instrument LlamaIndex:
from maxim import Config, Maximfrom maxim.logger import LoggerConfigfrom maxim.logger.llamaindex import instrument_llamaindex
# Initialize Maxim loggermaxim = Maxim(Config(api_key=os.getenv("MAXIM_API_KEY")))logger = maxim.logger(LoggerConfig(id=os.getenv("MAXIM_LOG_REPO_ID")))
# Instrument LlamaIndex with Maxim observability# Set debug=True to see detailed logs during developmentinstrument_llamaindex(logger, debug=True)
print("✅ Maxim instrumentation enabled for LlamaIndex")
Now your LlamaIndex applications will automatically send traces to Maxim:
from llama_index.core.agent import FunctionAgentfrom llama_index.core.tools import FunctionToolfrom llama_index.llms.openai import OpenAI

# Define tools and create agentdef add_numbers(a: float, b: float) -> float:    """Add two numbers together."""    return a + b

add_tool = FunctionTool.from_defaults(fn=add_numbers)llm = OpenAI(model="gpt-4o-mini", temperature=0)
agent = FunctionAgent(    tools=[add_tool],    llm=llm,    verbose=True,    system_prompt="You are a helpful calculator assistant.",)
# This will be automatically logged by Maxim instrumentationimport asyncio
response = await agent.run("What is 15 + 25?")print(f"Response: {response}")
Guides
Section titled “Guides”
Other Partner One-Click Integrations (Legacy Modules)
Section titled “Other Partner One-Click Integrations (Legacy Modules)”These partner integrations use our legacy CallbackManager or third-party calls.
Langfuse
Section titled “Langfuse”This integration is deprecated. We recommend using the new instrumentation-based integration with Langfuse as described here.
Usage Pattern
Section titled “Usage Pattern”from llama_index.core import set_global_handler
# Make sure you've installed the 'llama-index-callbacks-langfuse' integration package.
# NOTE: Set your environment variables 'LANGFUSE_SECRET_KEY', 'LANGFUSE_PUBLIC_KEY' and 'LANGFUSE_HOST'# as shown in your langfuse.com project settings.
set_global_handler("langfuse")Guides
Section titled “Guides”
OpenInference
Section titled “OpenInference”OpenInference is an open standard for capturing and storing AI model inferences. It enables experimentation, visualization, and evaluation of LLM applications using LLM observability solutions such as Phoenix.
Usage Pattern
Section titled “Usage Pattern”import llama_index.core
llama_index.core.set_global_handler("openinference")
# NOTE: No need to do the followingfrom llama_index.callbacks.openinference import OpenInferenceCallbackHandlerfrom llama_index.core.callbacks import CallbackManagerfrom llama_index.core import Settings
# callback_handler = OpenInferenceCallbackHandler()# Settings.callback_manager = CallbackManager([callback_handler])
# Run your LlamaIndex application here...for query in queries: query_engine.query(query)
# View your LLM app data as a dataframe in OpenInference format.from llama_index.core.callbacks.open_inference_callback import as_dataframe
query_data_buffer = llama_index.core.global_handler.flush_query_data_buffer()query_dataframe = as_dataframe(query_data_buffer)NOTE: To unlock capabilities of Phoenix, you will need to define additional steps to feed in query/ context dataframes. See below!
Guides
Section titled “Guides”TruEra TruLens
Section titled “TruEra TruLens”TruLens allows users to instrument/evaluate LlamaIndex applications, through features such as feedback functions and tracing.
Usage Pattern + Guides
Section titled “Usage Pattern + Guides”# use trulensfrom trulens_eval import TruLlama
tru_query_engine = TruLlama(query_engine)
# querytru_query_engine.query("What did the author do growing up?")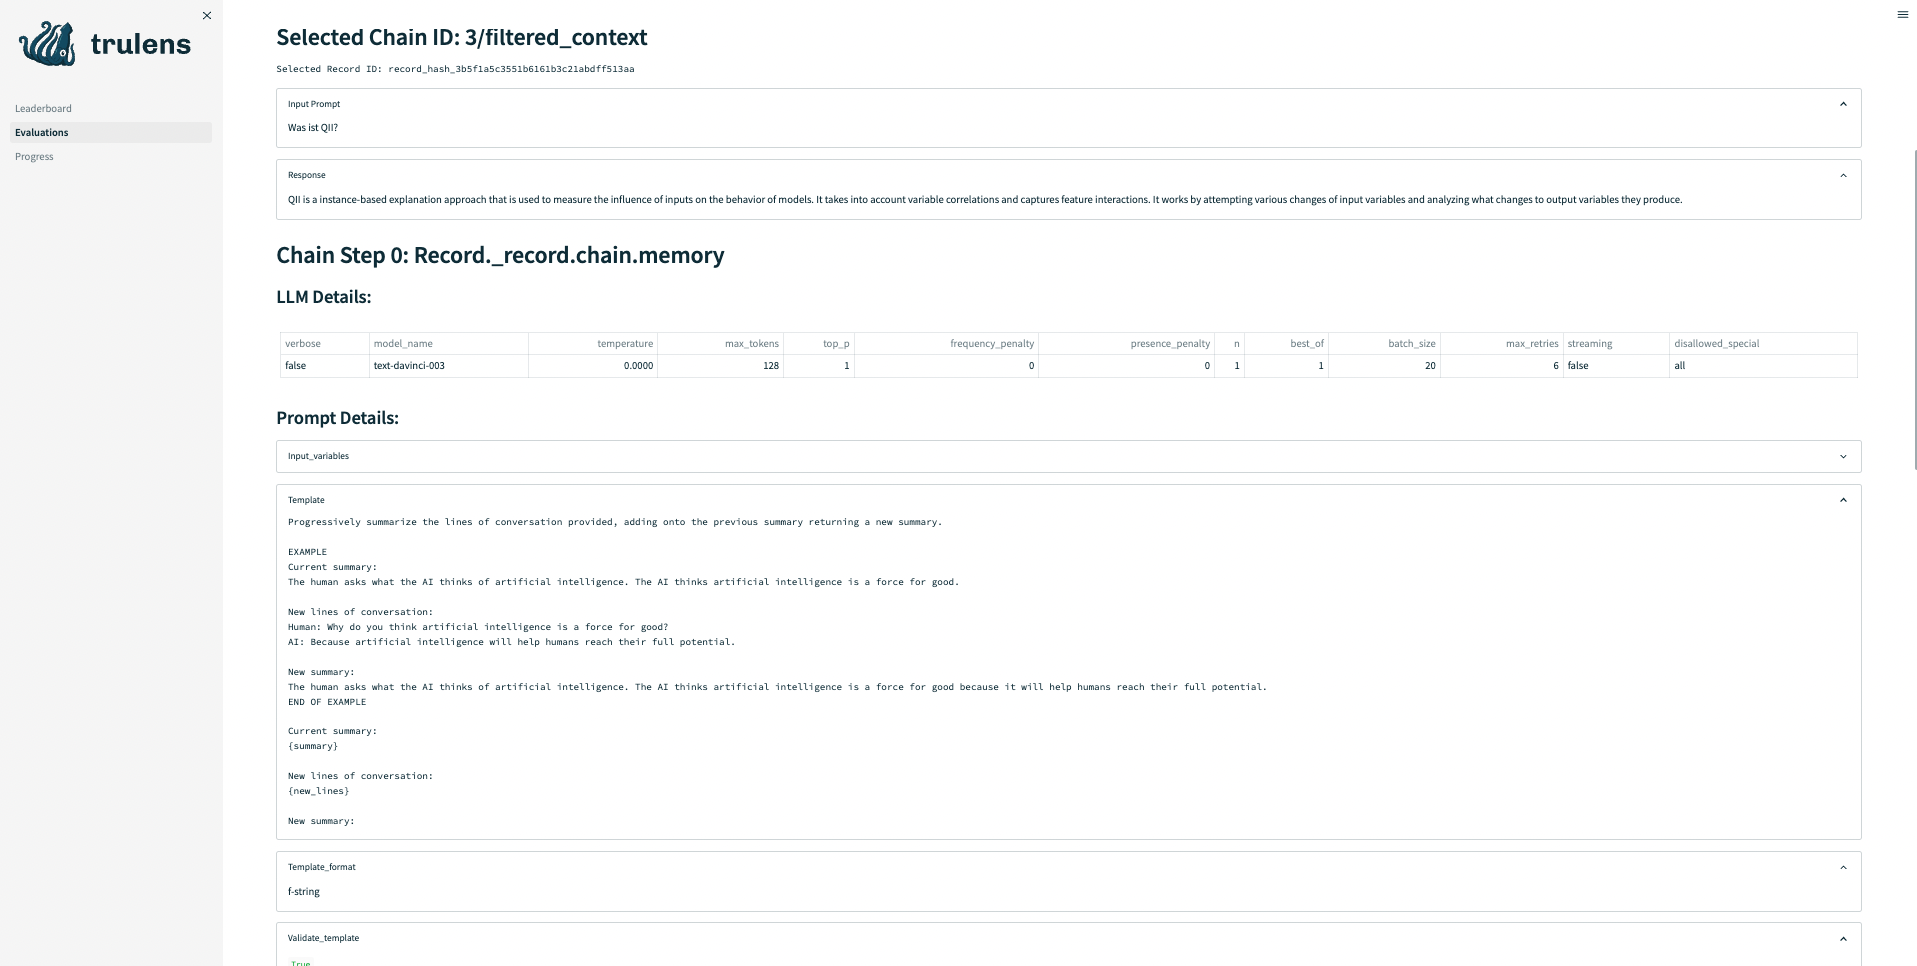
Guides
Section titled “Guides”HoneyHive
Section titled “HoneyHive”HoneyHive allows users to trace the execution flow of any LLM workflow. Users can then debug and analyze their traces, or customize feedback on specific trace events to create evaluation or fine-tuning datasets from production.
Usage Pattern
Section titled “Usage Pattern”from llama_index.core import set_global_handler
set_global_handler( "honeyhive", project="My HoneyHive Project", name="My LLM Workflow Name", api_key="MY HONEYHIVE API KEY",)
# NOTE: No need to do the followingfrom llama_index.core.callbacks import CallbackManager
# from honeyhive.utils.llamaindex_tracer import HoneyHiveLlamaIndexTracerfrom llama_index.core import Settings
# hh_tracer = HoneyHiveLlamaIndexTracer(# project="My HoneyHive Project",# name="My LLM Workflow Name",# api_key="MY HONEYHIVE API KEY",# )# Settings.callback_manager = CallbackManager([hh_tracer])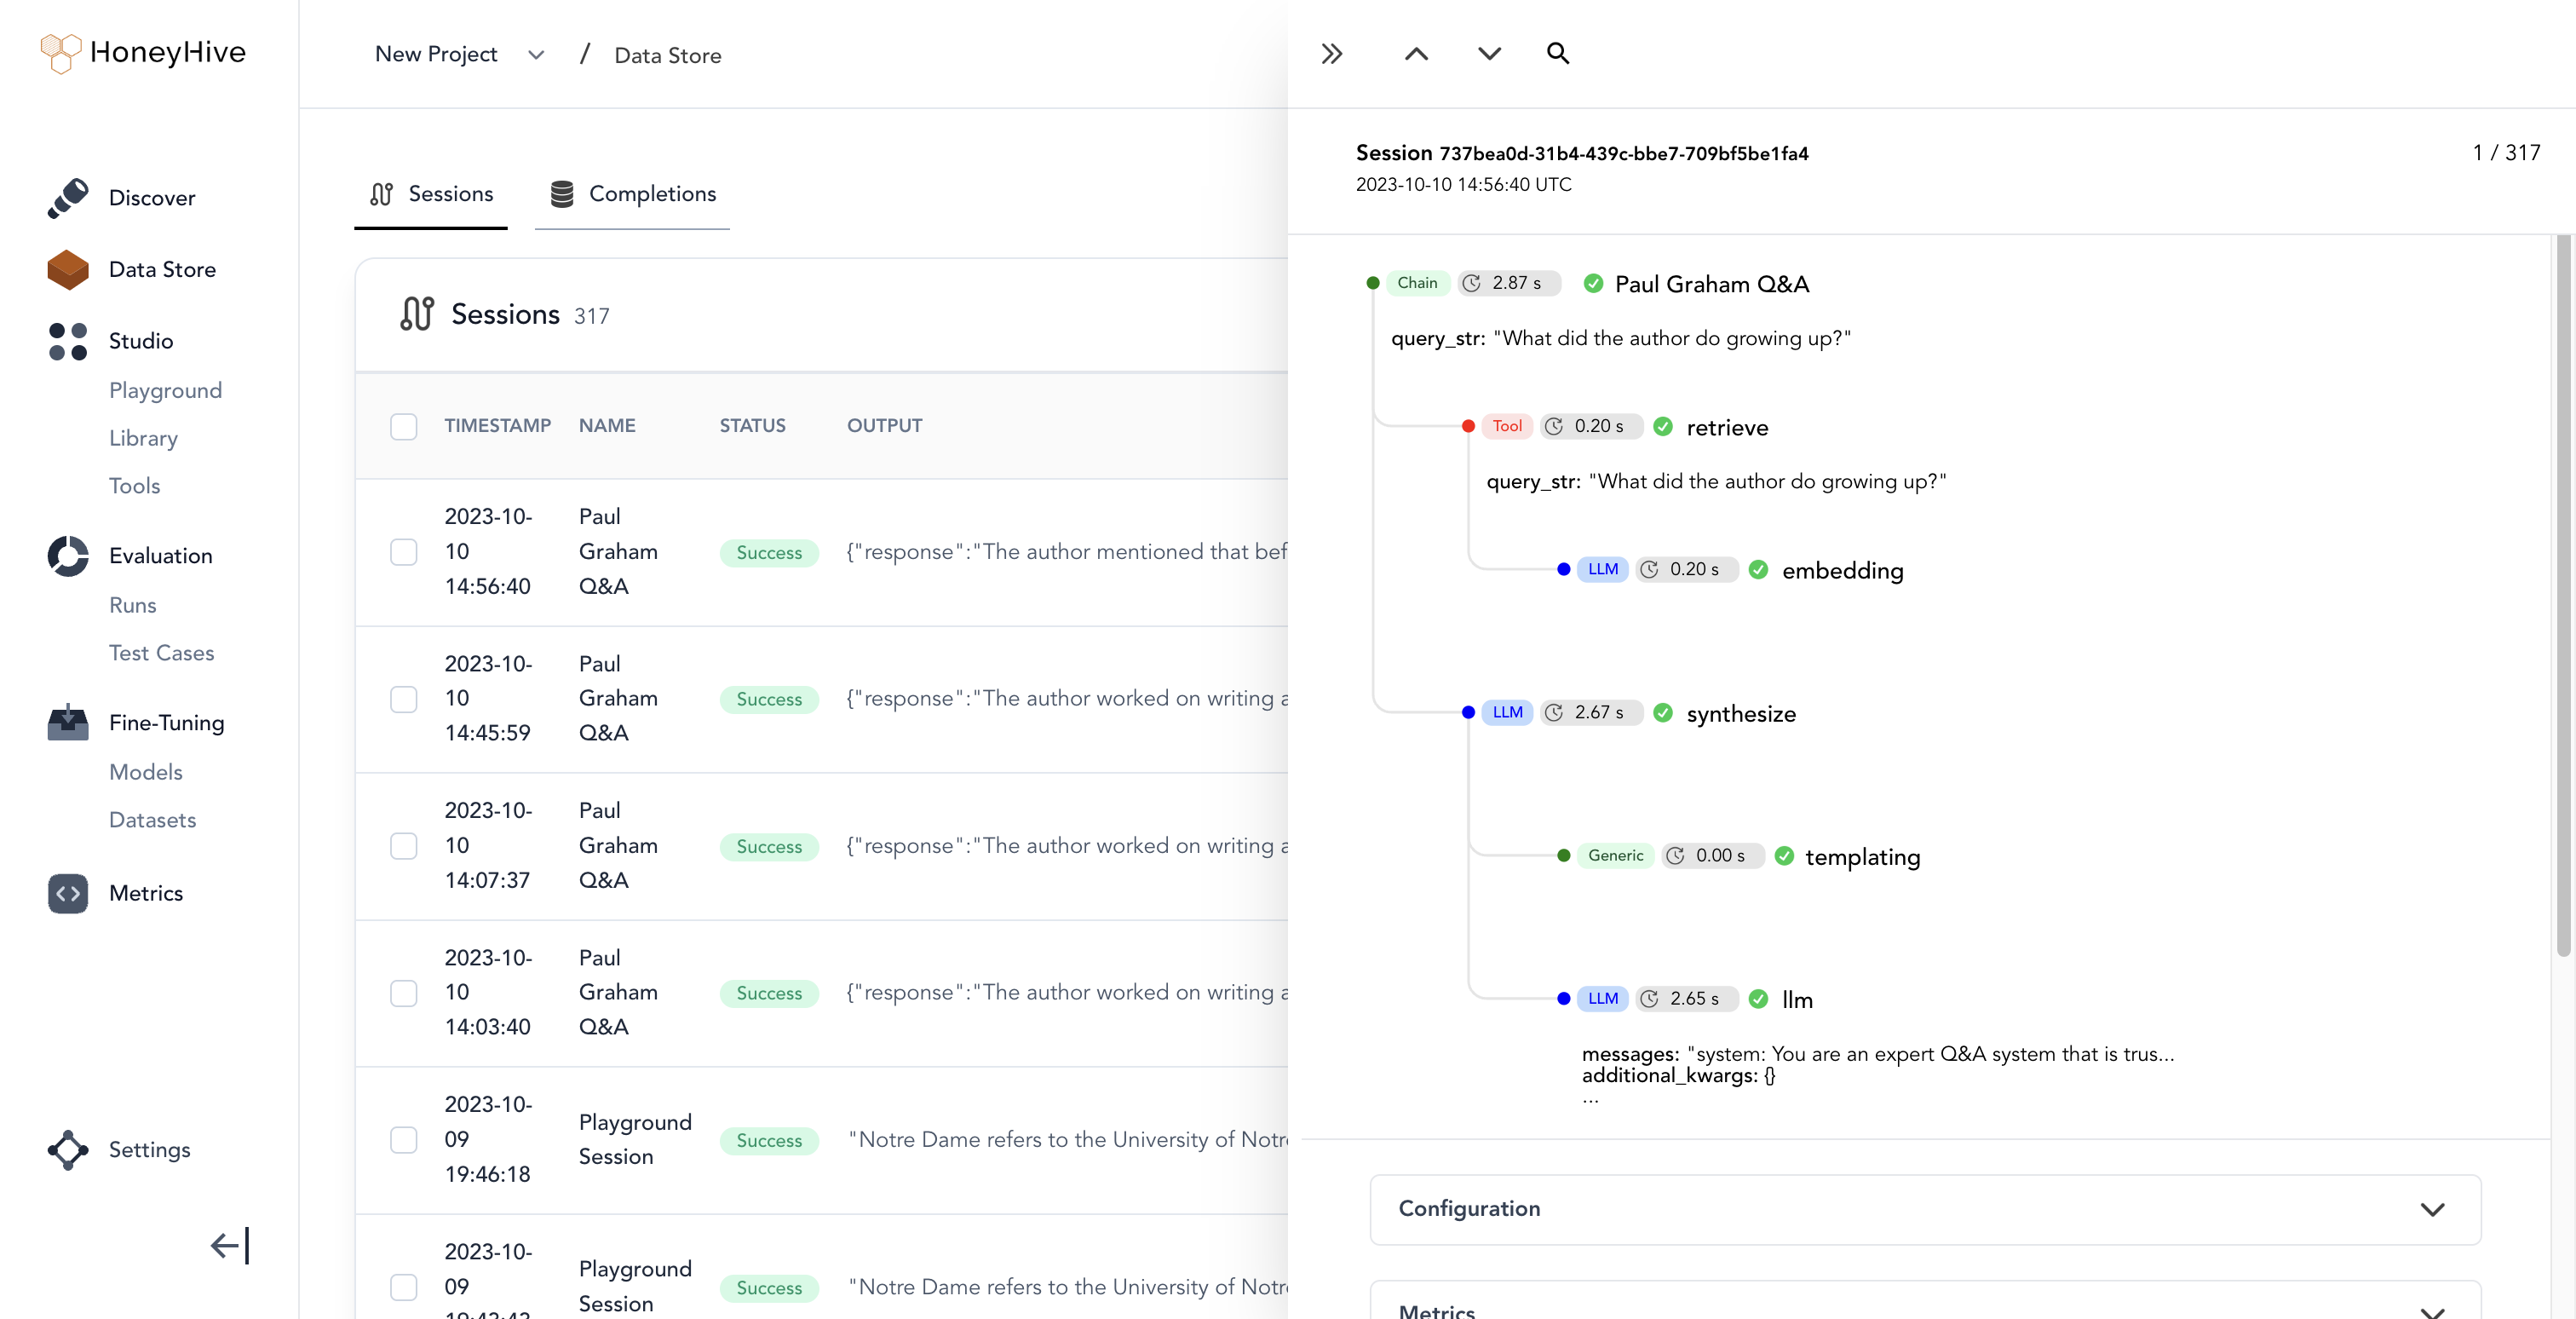
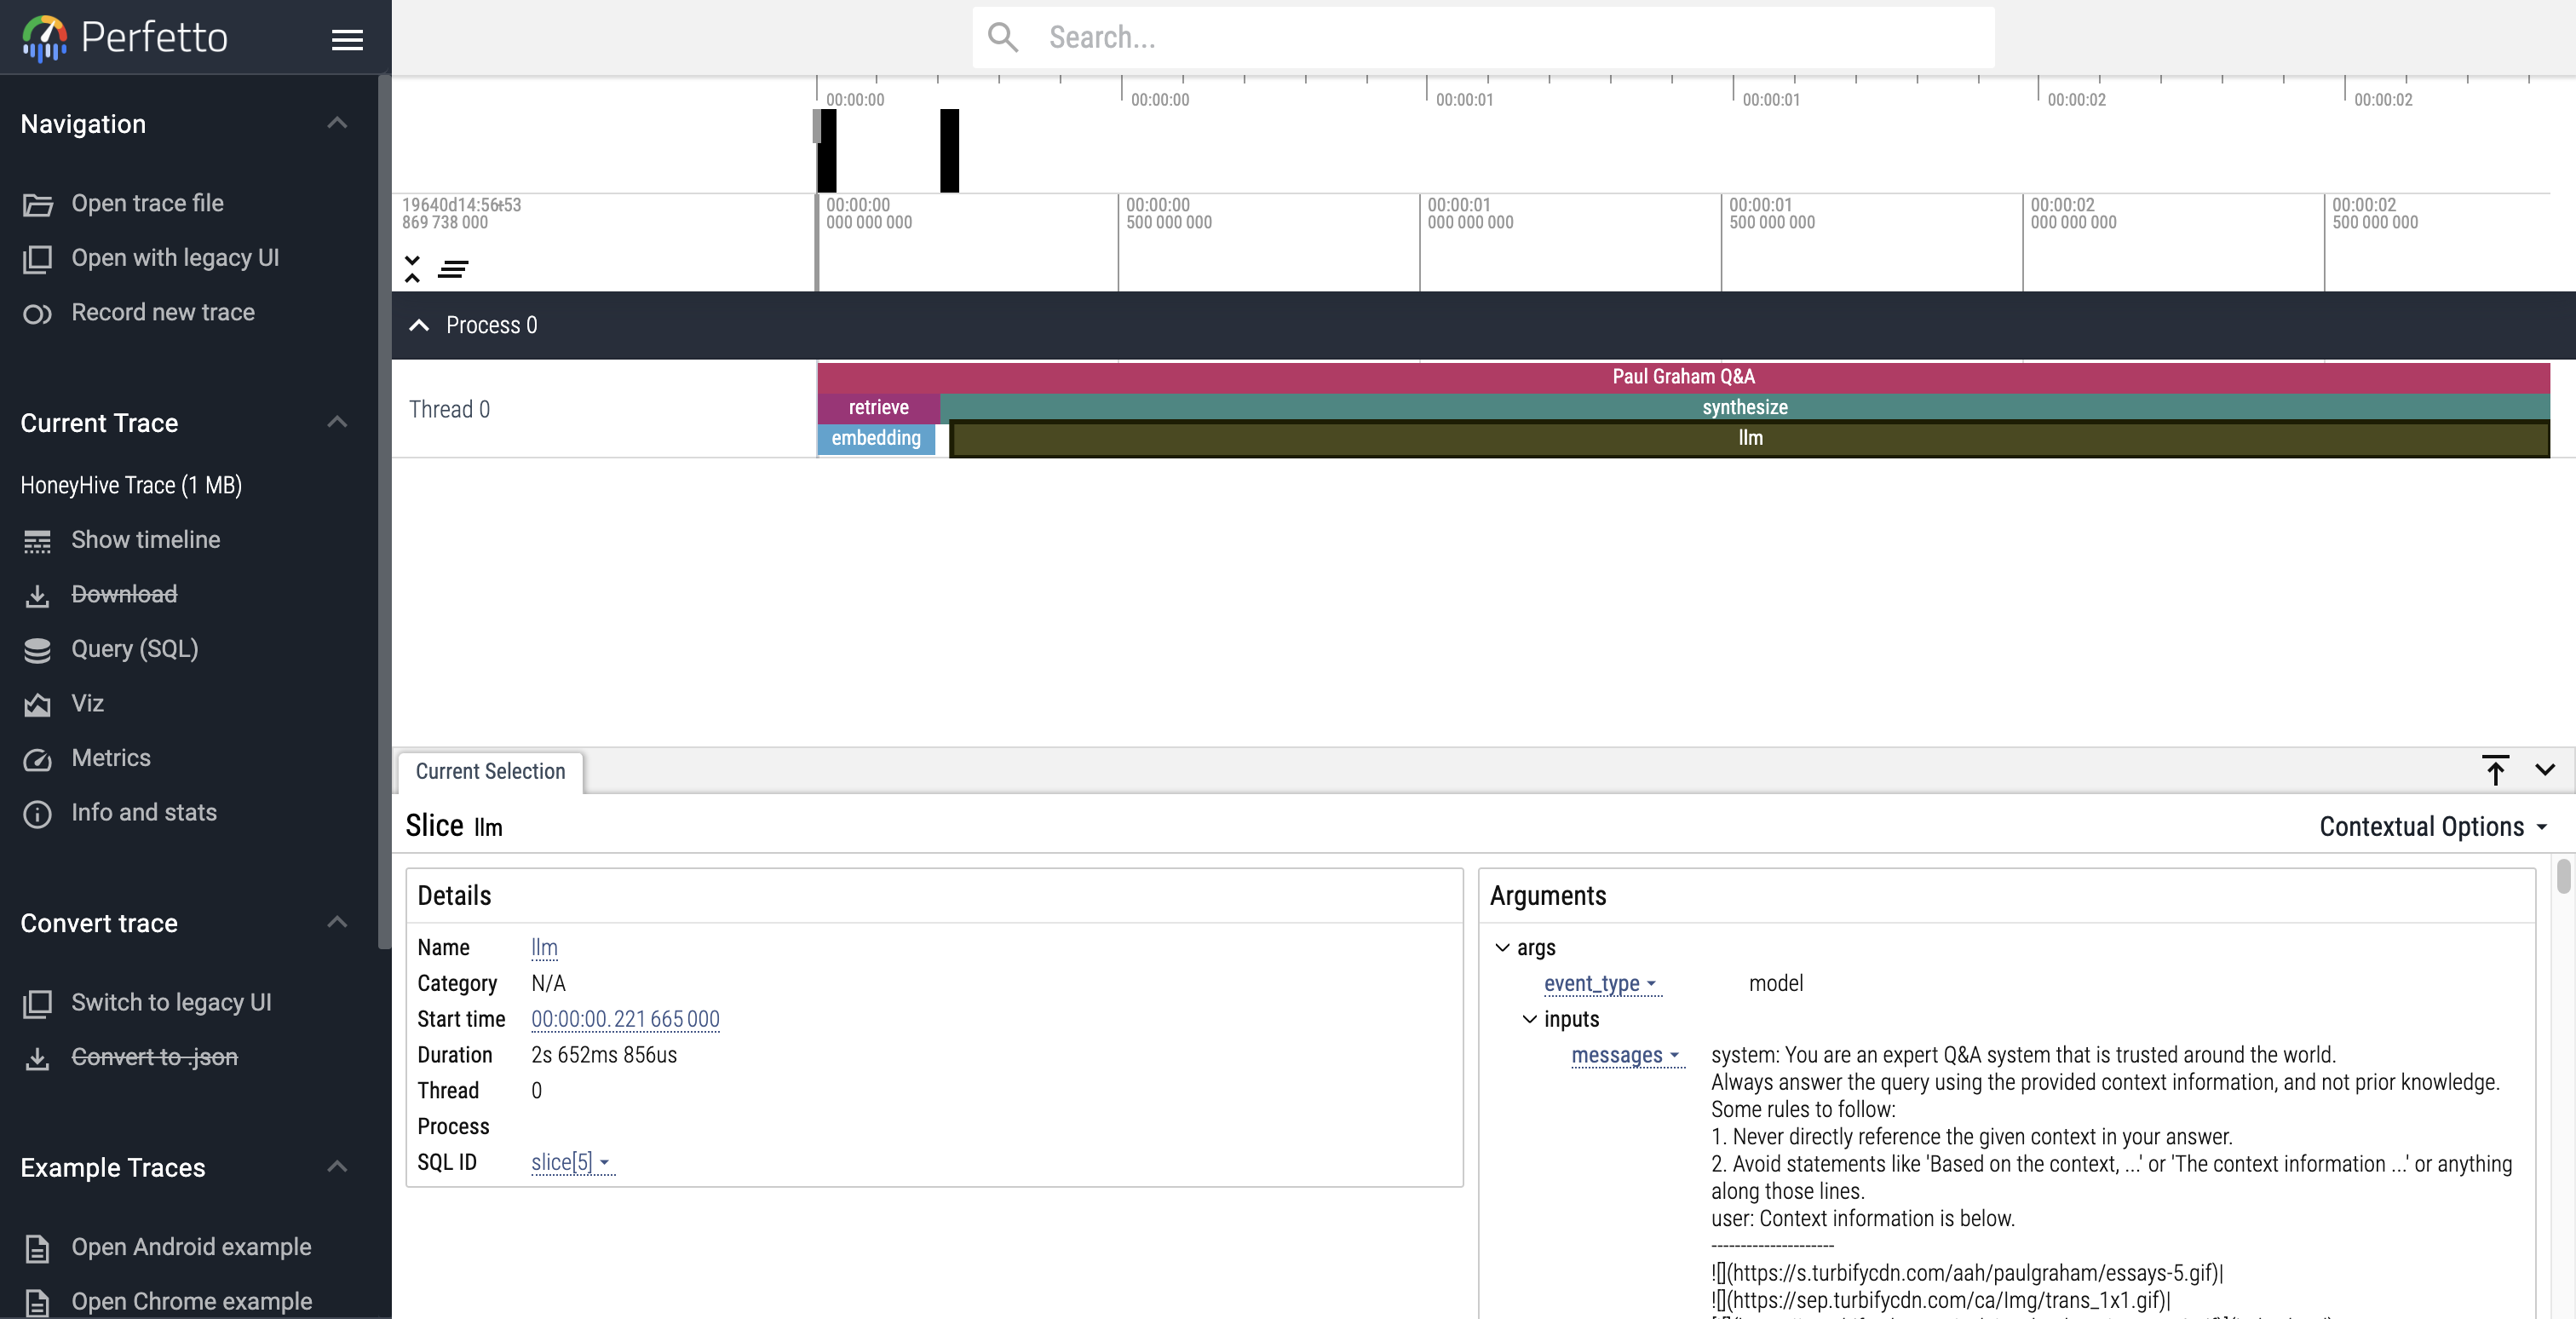 Use Perfetto to debug and analyze your HoneyHive traces
Guides
Section titled “Guides”PromptLayer
Section titled “PromptLayer”PromptLayer allows you to track analytics across LLM calls, tagging, analyzing, and evaluating prompts for various use-cases. Use it with LlamaIndex to track the performance of your RAG prompts and more.
Usage Pattern
Section titled “Usage Pattern”import os
os.environ["PROMPTLAYER_API_KEY"] = "pl_7db888a22d8171fb58aab3738aa525a7"
from llama_index.core import set_global_handler
# pl_tags are optional, to help you organize your prompts and appsset_global_handler("promptlayer", pl_tags=["paul graham", "essay"])Guides
Section titled “Guides”Langtrace
Section titled “Langtrace”Langtrace is a robust open-source tool that supports OpenTelemetry and is designed to trace, evaluate, and manage LLM applications seamlessly. Langtrace integrates directly with LlamaIndex, offering detailed, real-time insights into performance metrics such as accuracy, evaluations, and latency.
Install
Section titled “Install”pip install langtrace-python-sdkUsage Pattern
Section titled “Usage Pattern”from langtrace_python_sdk import ( langtrace,) # Must precede any llm module imports
langtrace.init(api_key="<LANGTRACE_API_KEY>")Guides
Section titled “Guides”OpenLIT
Section titled “OpenLIT”OpenLIT is an OpenTelemetry-native GenAI and LLM Application Observability tool. It’s designed to make the integration process of observability into GenAI projects with just a single line of code. OpenLIT provides OpenTelemetry Auto instrumentation for various LLMs, VectorDBs and Frameworks like LlamaIndex. OpenLIT provides insights into your LLM Applications performance, tracing of requests, over view metrics on usage like costs, tokens and a lot more.
Install
Section titled “Install”pip install openlitUsage Pattern
Section titled “Usage Pattern”import openlit
openlit.init()Guides
Section titled “Guides”AgentOps
Section titled “AgentOps”AgentOps helps developers build, evaluate, and monitor AI agents. AgentOps will help build agents from prototype to production, enabling agent monitoring, LLM cost tracking, benchmarking, and more.
Install
Section titled “Install”pip install llama-index-instrumentation-agentopsUsage Pattern
Section titled “Usage Pattern”from llama_index.core import set_global_handler
# NOTE: Feel free to set your AgentOps environment variables (e.g., 'AGENTOPS_API_KEY')# as outlined in the AgentOps documentation, or pass the equivalent keyword arguments# anticipated by AgentOps' AOClient as **eval_params in set_global_handler.
set_global_handler("agentops")Simple (LLM Inputs/Outputs)
Section titled “Simple (LLM Inputs/Outputs)”This simple observability tool prints every LLM input/output pair to the terminal. Most useful for when you need to quickly enable debug logging on your LLM application.
Usage Pattern
Section titled “Usage Pattern”import llama_index.core
llama_index.core.set_global_handler("simple")