

Multi-Modal LLM using Mistral `pixtral-large` for image reasoning
In this notebook, we show how to use MistralAI MultiModal LLM class/abstraction for image understanding/reasoning.
We demonstrate following functions that are supported for MistralAI Pixtral Multimodal LLM:
complete(both sync and async): for a single prompt and list of imagesstream complete(both sync and async): for steaming output of complete
%pip install llama-index-multi-modal-llms-mistralai%pip install matplotlibimport osfrom IPython.display import Markdown, display
os.environ[ "MISTRAL_API_KEY"] = "<YOUR API KEY>" # Your MistralAI API token hereInitialize MistralAIMultiModal
Section titled “Initialize MistralAIMultiModal”from llama_index.multi_modal_llms.mistralai import MistralAIMultiModal
mistralai_mm_llm = MistralAIMultiModal( model="pixtral-large-latest", max_new_tokens=1000)[nltk_data] Downloading package stopwords to[nltk_data] /Users/ravithejad/Desktop/llamaindex/lib/python3.9/sit[nltk_data] e-packages/llama_index/core/_static/nltk_cache...[nltk_data] Package stopwords is already up-to-date!/Users/ravithejad/Desktop/llamaindex/lib/python3.9/site-packages/urllib3/__init__.py:35: NotOpenSSLWarning: urllib3 v2 only supports OpenSSL 1.1.1+, currently the 'ssl' module is compiled with 'LibreSSL 2.8.3'. See: https://github.com/urllib3/urllib3/issues/3020 warnings.warn(Load Images from URLs
Section titled “Load Images from URLs”from llama_index.core.multi_modal_llms.generic_utils import load_image_urls
image_urls = [ "https://tripfixers.com/wp-content/uploads/2019/11/eiffel-tower-with-snow.jpeg", "https://cdn.statcdn.com/Infographic/images/normal/30322.jpeg",]
image_documents = load_image_urls(image_urls)First Image
Section titled “First Image”from PIL import Imageimport requestsfrom io import BytesIOimport matplotlib.pyplot as plt
headers = { "User-Agent": "Mozilla/5.0 (Windows NT 10.0; Win64; x64) AppleWebKit/537.36 (KHTML, like Gecko) Chrome/58.0.3029.110 Safari/537.3"}img_response = requests.get(image_urls[0], headers=headers)
print(image_urls[0])
img = Image.open(BytesIO(img_response.content))plt.imshow(img)https://tripfixers.com/wp-content/uploads/2019/11/eiffel-tower-with-snow.jpeg
<matplotlib.image.AxesImage at 0x2c2566520>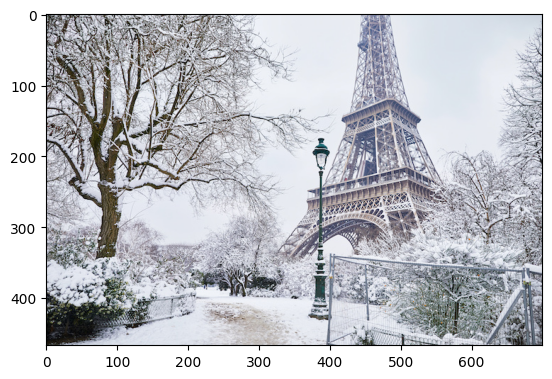
Second Image
Section titled “Second Image”img_response = requests.get(image_urls[1], headers=headers)
print(image_urls[1])
img = Image.open(BytesIO(img_response.content))plt.imshow(img)https://cdn.statcdn.com/Infographic/images/normal/30322.jpeg
<matplotlib.image.AxesImage at 0x2c26940a0>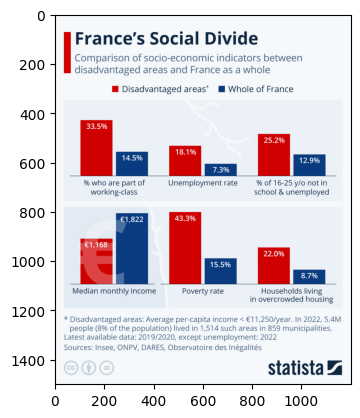
Complete a prompt with a bunch of images
Section titled “Complete a prompt with a bunch of images”complete_response = mistralai_mm_llm.complete( prompt="Describe the images as an alternative text in a few words", image_documents=image_documents,)display(Markdown(f"{complete_response}"))The first image shows the Eiffel Tower in Paris covered in snow, with trees and a pathway also blanketed in white.
The second image is an infographic titled “France’s Social Divide,” comparing socio-economic indicators between disadvantaged areas and the whole of France. Key points include:
- 33.5% of people in disadvantaged areas are part of the working class, compared to 14.5% in the whole of France.
- The unemployment rate is 18.1% in disadvantaged areas versus 7.3% nationally.
- 25.2% of 16-25 year-olds in disadvantaged areas are not in school and unemployed, compared to 12.9% nationally.
- The median monthly income is €1,168 in disadvantaged areas, compared to €1,822 nationally.
- The poverty rate is 43.3% in disadvantaged areas, compared to 15.5% nationally.
- 22.0% of households in disadvantaged areas live in overcrowded housing, compared to 8.7% nationally.
The data sources include Insee, ONPV, DARES, and Observatoire des Inégalités, with the latest available data from 2
Steam Complete a prompt with a bunch of images
Section titled “Steam Complete a prompt with a bunch of images”stream_complete_response = mistralai_mm_llm.stream_complete( prompt="give me more context for this images in a few words", image_documents=image_documents,)for r in stream_complete_response: print(r.delta, end="")The images highlight the socio-economic disparities in France, particularly between disadvantaged areas and the country as a whole. The first image shows the Eiffel Tower in a snowy landscape, symbolizing France. The second image is an infographic comparing various socio-economic indicators between disadvantaged areas and the entire nation. Key points include:
1. **Working-Class Participation**: Only 33.5% of people in disadvantaged areas are part of the working class, compared to 45.5% nationally.2. **Unemployment Rate**: The unemployment rate in disadvantaged areas is significantly higher at 18.1%, compared to 7.3% nationally.3. **Youth Not in School or Employed**: 25.2% of youth aged 16-25 in disadvantaged areas are neither in school nor employed, compared to 12.9% nationally.4. **Median Monthly Income**: The median monthly income in disadvantaged areas is €1,168, much lower than the national median of €1,822.5. **Poverty Rate**: The poverty rate in disadvantaged areas is 43.3%, compared to 15.5% nationally.6. **Overcrowded Housing**: 22% ofAsync Complete
Section titled “Async Complete”response_acomplete = await mistralai_mm_llm.acomplete( prompt="Describe the images as an alternative text in a few words", image_documents=image_documents,)display(Markdown(f"{response_acomplete}"))The first image shows the Eiffel Tower in Paris, France, covered in snow with trees and a pathway also blanketed in white.
The second image is an infographic titled “France’s Social Divide,” comparing socio-economic indicators between disadvantaged areas and the whole of France. Key points include:
- Percentage of people part of the working class: 33.5% in disadvantaged areas vs. 14.5% in the whole of France.
- Unemployment rate: 18.1% in disadvantaged areas vs. 7.3% in the whole of France.
- Percentage of 16-25 year-olds not in school and unemployed: 25.2% in disadvantaged areas vs. 12.9% in the whole of France.
- Median monthly income: €1,168 in disadvantaged areas vs. €1,822 in the whole of France.
- Poverty rate: 43.3% in disadvantaged areas vs. 15.5% in the whole of France.
- Households living in overcrowded housing: 22.0% in disadvantaged areas vs. 8.7% in the whole of France.
The data is sourced from Insee, ONPV
Async Steam Complete
Section titled “Async Steam Complete”response_astream_complete = await mistralai_mm_llm.astream_complete( prompt="Describe the images as an alternative text in a few words", image_documents=image_documents,)async for delta in response_astream_complete: print(delta.delta, end="")The first image shows the Eiffel Tower in Paris, France, covered in snow with trees and a pathway also covered in snow.
The second image is an infographic titled "France's Social Divide," comparing socio-economic indicators between disadvantaged areas and France as a whole. Key points include:- 33.5% of people in disadvantaged areas are part of the working class, compared to 14.5% in the whole of France.- The unemployment rate is 18.1% in disadvantaged areas versus 7.3% in the whole of France.- 25.2% of 16-25 year-olds in disadvantaged areas are not in school and unemployed, compared to 12.9% in the whole of France.- The median monthly income is €1,168 in disadvantaged areas and €1,822 in the whole of France.- The poverty rate is 43.3% in disadvantaged areas and 15.5% in the whole of France.- 22.0% of households in disadvantaged areas live in overcrowded housing, compared to 8.7% in the whole of France.
The data sources include Insee, ONPV, DARES, and Observatoire des InComplete with Two images
Section titled “Complete with Two images”image_urls = [ "https://tripfixers.com/wp-content/uploads/2019/11/eiffel-tower-with-snow.jpeg", "https://assets.visitorscoverage.com/production/wp-content/uploads/2024/04/AdobeStock_626542468-min-1024x683.jpeg",]Lets Inspect the images.
Section titled “Lets Inspect the images.”First Image
Section titled “First Image”img_response = requests.get(image_urls[0], headers=headers)
print(image_urls[0])
img = Image.open(BytesIO(img_response.content))plt.imshow(img)https://tripfixers.com/wp-content/uploads/2019/11/eiffel-tower-with-snow.jpeg
<matplotlib.image.AxesImage at 0x2c4d4c280>
Second Image
Section titled “Second Image”img_response = requests.get(image_urls[1], headers=headers)
print(image_urls[1])
img = Image.open(BytesIO(img_response.content))plt.imshow(img)https://assets.visitorscoverage.com/production/wp-content/uploads/2024/04/AdobeStock_626542468-min-1024x683.jpeg
<matplotlib.image.AxesImage at 0x2c510d850>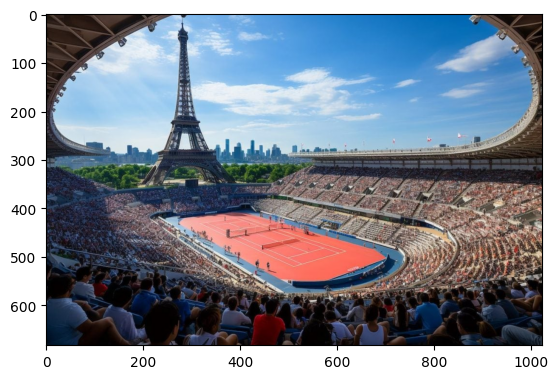
image_documents_compare = load_image_urls(image_urls)
response_multi = mistralai_mm_llm.complete( prompt="What are the differences between two images?", image_documents=image_documents_compare,)display(Markdown(f"{response_multi}"))The first image shows the Eiffel Tower in winter with snow on the ground and trees, while the second image shows a tennis court with a crowd of people watching a match. The first image has no people in it, while the second image has many people in it. The first image is taken during the day, while the second image is taken during the night. The first image has a park bench in it, while the second image has a tennis court in it. The first image has a fence in it, while the second image has a stadium in it.
Load Images from local files
Section titled “Load Images from local files”!wget 'https://www.boredpanda.com/blog/wp-content/uploads/2022/11/interesting-receipts-102-6364c8d181c6a__700.jpg' -O 'receipt.jpg'--2024-11-18 21:51:11-- https://www.boredpanda.com/blog/wp-content/uploads/2022/11/interesting-receipts-102-6364c8d181c6a__700.jpgResolving www.boredpanda.com (www.boredpanda.com)... 18.161.111.92, 18.161.111.28, 18.161.111.66, ...Connecting to www.boredpanda.com (www.boredpanda.com)|18.161.111.92|:443... connected.HTTP request sent, awaiting response... 200 OKLength: 112631 (110K) [image/jpeg]Saving to: ‘receipt.jpg’
receipt.jpg 100%[===================>] 109.99K 450KB/s in 0.2s
2024-11-18 21:51:16 (450 KB/s) - ‘receipt.jpg’ saved [112631/112631]from PIL import Imageimport matplotlib.pyplot as plt
img = Image.open("./receipt.jpg")plt.imshow(img)<matplotlib.image.AxesImage at 0x2c51a5a60>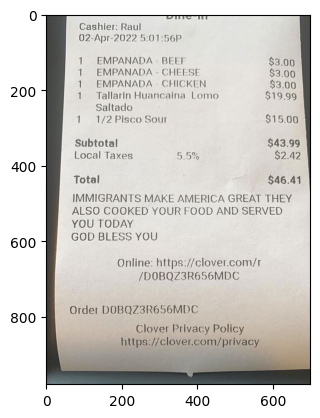
from llama_index.core import SimpleDirectoryReader
# put your local directore hereimage_documents = SimpleDirectoryReader(    input_files=["./receipt.jpg"]).load_data()
response = mistralai_mm_llm.complete( prompt="Transcribe the text in the image", image_documents=image_documents,)display(Markdown(f"{response}"))Sure, here is the transcription of the text in the image:
Dine-in
Cashier: Raul 02-Apr-2022 5:01:56P
1 EMPANADA - BEEF $3.00 1 EMPANADA - CHEESE $3.00 1 EMPANADA - CHICKEN $3.00 1 Tallarin Huancaina Lomo Saltado $19.99 1 1/2 Pisco Sour $15.00
Subtotal $43.99 Local Taxes 5.5% $2.42
Total $46.41
IMMIGRANTS MAKE AMERICA GREAT THEY ALSO COOKED YOUR FOOD AND SERVED YOU TODAY GOD BLESS YOU
Online: https://clover.com/r/D0BQZ3R656MDC
Order D0BQZ3R656MDC
Clover Privacy Policy https://clover.com/privacy