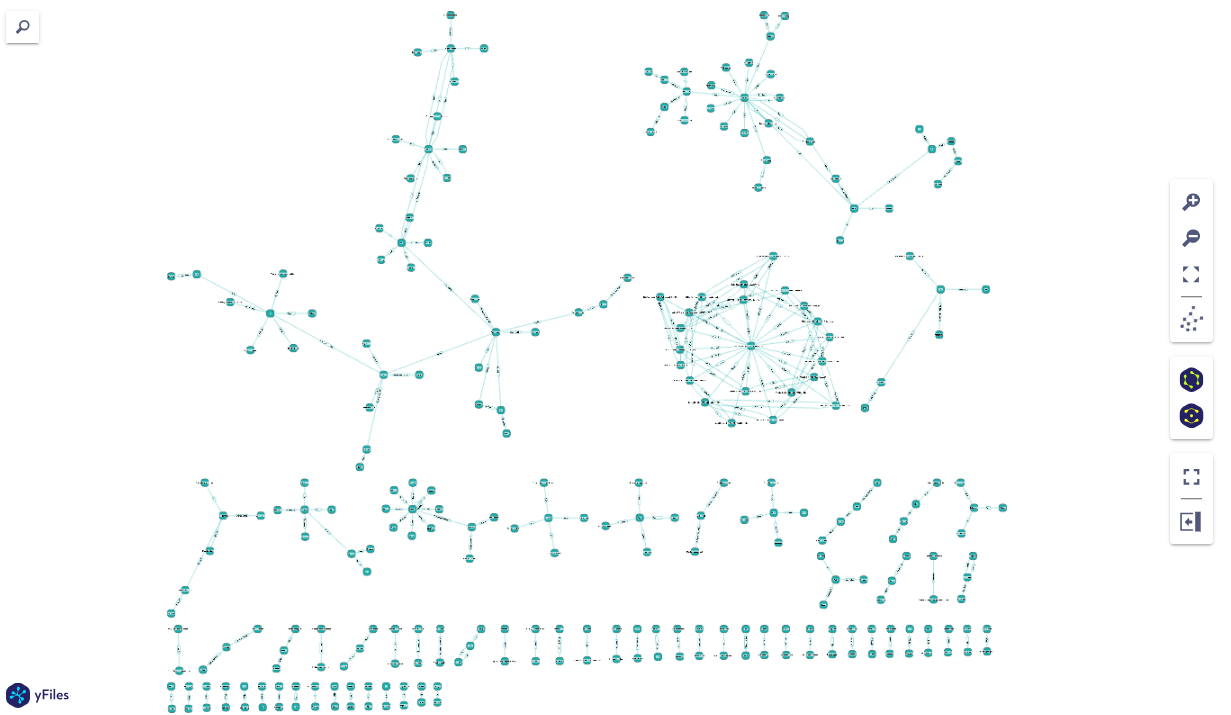
Property Graph Index Visualization
Similar to the property_graph_basic notebook, in this notebook, we demonstrate an alternative visualization approach for the default SimplePropertyGraphStore
While the focus of the other notebook is querying the graph, this notebook focuses on the visualization aspect of what was created.
%pip install llama-indeximport osimport urllib.request
os.environ["OPENAI_API_KEY"] = "sk-proj-..."url = "https://raw.githubusercontent.com/run-llama/llama_index/main/docs/examples/data/paul_graham/paul_graham_essay.txt"filename = "data/paul_graham/paul_graham_essay.txt"os.makedirs(os.path.dirname(filename), exist_ok=True)urllib.request.urlretrieve(url, filename)import nest_asyncio
nest_asyncio.apply()from llama_index.core import SimpleDirectoryReaderdocuments = SimpleDirectoryReader("./data/paul_graham/").load_data()Construction
Section titled “Construction”from llama_index.core import PropertyGraphIndexfrom llama_index.embeddings.openai import OpenAIEmbeddingfrom llama_index.llms.openai import OpenAI
index = PropertyGraphIndex.from_documents( documents, llm=OpenAI(model="gpt-3.5-turbo", temperature=0.3), embed_model=OpenAIEmbedding(model_name="text-embedding-3-small"), show_progress=True,)Visualization
Section titled “Visualization”Let’s explore what we created. Using the show_jupyter_graph() method to create our graph directly in the Jupyter cell!
Note that this only works in Jupyter environments.
index.property_graph_store.show_jupyter_graph()